Helix Energy Solutions Group, Inc. (HLX): Price and Financial Metrics


Helix Energy Solutions Group, Inc. (HLX): $7.63

0.33 (+4.52%)

POWR Rating

Component Grades

Growth

S

Value

I

Momentum

G

Stability

N

Sentiment

U

Quality

P

HLX POWR Grades

  • HLX scores best on the Momentum dimension, with a Momentum rank ahead of 99.67% of US stocks.
  • HLX's strongest trending metric is Value; it's been moving down over the last 178 days.
  • HLX's current lowest rank is in the Stability metric (where it is better than 11.03% of US stocks).

HLX Stock Summary

  • Of note is the ratio of HELIX ENERGY SOLUTIONS GROUP INC's sales and general administrative expense to its total operating expenses; 81.66% of US stocks have a lower such ratio.
  • For HLX, its debt to operating expenses ratio is greater than that reported by 85.02% of US equities we're observing.
  • The volatility of HELIX ENERGY SOLUTIONS GROUP INC's share price is greater than that of 87.46% US stocks with at least 200 days of trading history.
  • Stocks with similar financial metrics, market capitalization, and price volatility to HELIX ENERGY SOLUTIONS GROUP INC are USAP, CRS, RILY, MTG, and GBX.
  • HLX's SEC filings can be seen here. And to visit HELIX ENERGY SOLUTIONS GROUP INC's official web site, go to www.helixesg.com.

HLX Valuation Summary

  • In comparison to the median Energy stock, HLX's price/sales ratio is 13.33% lower, now standing at 1.3.
  • HLX's price/sales ratio has moved down 1.1 over the prior 243 months.

Below are key valuation metrics over time for HLX.

Stock Date P/S P/B P/E EV/EBIT
HLX 2023-03-17 1.3 0.7 -12.5 -24.5
HLX 2023-03-16 1.3 0.7 -12.8 -25.0
HLX 2023-03-15 1.3 0.7 -12.7 -24.9
HLX 2023-03-14 1.4 0.8 -13.5 -26.0
HLX 2023-03-13 1.3 0.8 -13.2 -25.6
HLX 2023-03-10 1.4 0.8 -13.6 -26.3

HLX Growth Metrics

    Its 5 year price growth rate is now at -74.68%.
  • Its 2 year price growth rate is now at 168.35%.
  • The 2 year revenue growth rate now stands at -13.66%.
Over the past 67 months, HLX's revenue has gone up $252,869,000.

The table below shows HLX's growth in key financial areas (numbers in millions of US dollars).

Date Revenue Operating Cash Flow Net Income to Common Stock
2022-09-30 753.94 20.261 -116.401
2022-06-30 662.109 24.323 -116.681
2022-03-31 661.438 82.835 -100.691
2021-12-31 674.728 140.117 -61.538
2021-09-30 665.969 161.424 -31.467
2021-06-30 678.743 185.298 12.075

HLX's Quality Factors

The “Quality” component of the POWR Ratings focuses on 31 different factors of a companies fundamentals and operational strength. Here are some key insights as we drill into the specifics of these quality attributes.
  • HLX has a Quality Grade of C, ranking ahead of 66.09% of graded US stocks.
  • HLX's asset turnover comes in at 0.275 -- ranking 94th of 137 Petroleum and Natural Gas stocks.
  • GBR, CKX, and TELL are the stocks whose asset turnover ratios are most correlated with HLX.

The table below shows HLX's key quality metrics over time.

Period Asset Turnover Gross Margin ROIC
2021-09-30 0.275 0.052 -0.005
2021-06-30 0.276 0.097 0.017
2021-03-31 0.289 0.129 0.025
2020-12-31 0.293 0.109 0.013
2020-09-30 0.295 0.125 0.013
2020-06-30 0.299 0.148 0.013

HLX Price Target

For more insight on analysts targets of HLX, see our HLX price target page. And for a list of of all stocks sorted by upside potential based on analyst target price, see our Top Price Target page.

Average Price Target $5.61 Average Broker Recommendation 1.88 (Hold)

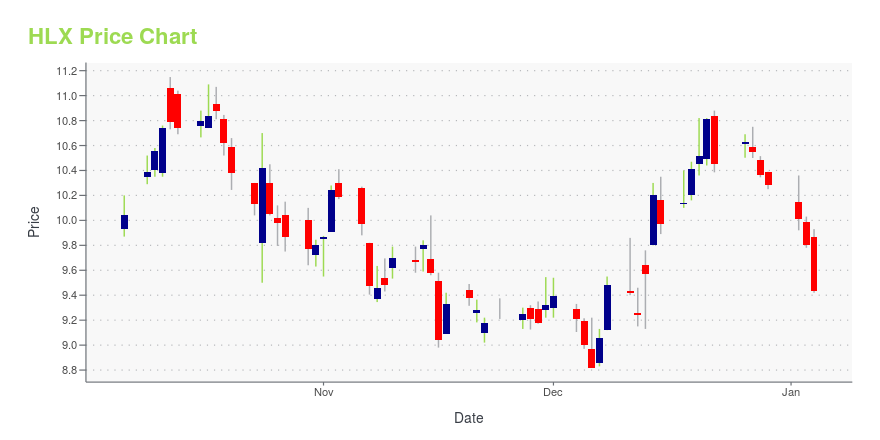
HLX Stock Price Chart Interactive Chart >

Price chart for HLX

HLX Price/Volume Stats

Current price $7.63 52-week high $9.16
Prev. close $7.30 52-week low $2.47
Day low $7.52 Volume 1,616,715
Day high $7.78 Avg. volume 2,007,347
50-day MA $7.91 Dividend yield N/A
200-day MA $5.58 Market Cap 1.16B

Helix Energy Solutions Group, Inc. (HLX) Company Bio


Helix Energy Solutions Group, Inc. provides specialty services to the offshore energy industry primarily in the Gulf of Mexico, North Sea, the Asia Pacific, and West Africa regions. The company was formerly known as Cal Dive International, Inc. and changed its name to Helix Energy Solutions Group, Inc. in March 2006. The company was founded in 1979 and is based in Houston, Texas.


HLX Latest News Stream


Event/Time News Detail
Loading, please wait...

HLX Latest Social Stream


Loading social stream, please wait...

View Full HLX Social Stream

Latest HLX News From Around the Web

Below are the latest news stories about HELIX ENERGY SOLUTIONS GROUP INC that investors may wish to consider to help them evaluate HLX as an investment opportunity.

Canadian Natural (CNQ) Q4 Earnings Lag Estimates, Revenues Beat

In 2023, Canadian Natural (CNQ) expects capex of $4,190 million, low maintenance capital for production growth, increasing shareholder returns and advancing value-adding projects.

Yahoo | March 20, 2023

Ovintiv's (OVV) Q4 Earnings Miss Estimates, Revenues Beat

Ovintiv (OVV) expects spending of $2.15-$2.35 billion, crude oil and condensate volumes of 165-175 K bpd and natural gas production of 1,525-1,575 MMcf/d in 2023.

Yahoo | March 20, 2023

Helix to Participate in Upcoming Event

HOUSTON, March 17, 2023--Helix Energy Solutions Group, Inc. (NYSE: HLX) announced today that it will participate in the Piper Sandler 23rd Annual Energy Conference in Las Vegas, Nevada at the Waldorf Astoria on Tuesday, March 21 and Wednesday, March 22, 2023.

Yahoo | March 17, 2023

Helix Announces Its 4.125% Convertible Senior Notes Due 2023 Have Become Convertible

HOUSTON, March 15, 2023--Helix Energy Solutions Group, Inc. ("Helix") (NYSE: HLX) announced today that its 4.125% Convertible Senior Notes due 2023 (the "Notes") are now convertible at the option of the holders, as provided in the indenture governing the Notes (the "Indenture").

Yahoo | March 15, 2023

Oceaneering's (OII) Q4 Earnings & Revenues Miss Estimates

Oceaneering International (OII) predicts 2023 consolidated EBITDA of $260-$310 million, free cash flow of $75-$125 million and capex of $90-$110 million.

Yahoo | March 15, 2023

Read More 'HLX' Stories Here

HLX Price Returns

1-mo 0.13%
3-mo 12.54%
6-mo 80.81%
1-year 59.62%
3-year 389.10%
5-year 25.70%
YTD 3.39%
2022 136.54%
2021 -25.71%
2020 -56.39%
2019 78.00%
2018 -28.25%

Continue Researching HLX

Want to see what other sources are saying about Helix Energy Solutions Group Inc's financials and stock price? Try the links below:

Helix Energy Solutions Group Inc (HLX) Stock Price | Nasdaq
Helix Energy Solutions Group Inc (HLX) Stock Quote, History and News - Yahoo Finance
Helix Energy Solutions Group Inc (HLX) Stock Price and Basic Information | MarketWatch

Get Free Updates

Join thousands of investors who get the latest news, insights and top rated picks from StockNews.com!


Page generated in 0.8014 seconds.