HomeStreet, Inc. (HMST): Price and Financial Metrics
GET POWR RATINGS... FREE!
HMST POWR Grades
- Value is the dimension where HMST ranks best; there it ranks ahead of 89.75% of US stocks.
- The strongest trend for HMST is in Quality, which has been heading down over the past 177 days.
- HMST ranks lowest in Growth; there it ranks in the 5th percentile.
HMST Stock Summary
- Equity multiplier, or assets relative to shareholders' equity, comes in at 15.03 for HOMESTREET INC; that's greater than it is for 96.38% of US stocks.
- With a year-over-year growth in debt of 642.64%, HOMESTREET INC's debt growth rate surpasses 97.33% of about US stocks.
- HOMESTREET INC's shareholder yield -- a measure of how much capital is returned to stockholders via dividends and buybacks -- is -285.13%, greater than the shareholder yield of only 2.27% of stocks in our set.
- If you're looking for stocks that are quantitatively similar to HOMESTREET INC, a group of peers worth examining would be FFNW, FMAO, LGIH, JCSE, and ZION.
- Visit HMST's SEC page to see the company's official filings. To visit the company's web site, go to www.homestreet.com.
HMST Valuation Summary
- HMST's price/sales ratio is 1.2; this is 20% higher than that of the median Financial Services stock.
- Over the past 135 months, HMST's price/sales ratio has gone down 0.3.
Below are key valuation metrics over time for HMST.
Stock | Date | P/S | P/B | P/E | EV/EBIT |
---|---|---|---|---|---|
HMST | 2023-03-17 | 1.2 | 0.6 | 5.3 | 18.0 |
HMST | 2023-03-16 | 1.3 | 0.7 | 5.7 | 18.3 |
HMST | 2023-03-15 | 1.3 | 0.7 | 5.8 | 18.3 |
HMST | 2023-03-14 | 1.3 | 0.7 | 5.5 | 18.1 |
HMST | 2023-03-13 | 1.3 | 0.7 | 5.6 | 18.2 |
HMST | 2023-03-10 | 1.4 | 0.7 | 5.9 | 18.4 |
HMST Growth Metrics
- Its 3 year price growth rate is now at 37.97%.
- Its year over year cash and equivalents growth rate is now at 6.89%.
- Its year over year price growth rate is now at -10.85%.

The table below shows HMST's growth in key financial areas (numbers in millions of US dollars).
Date | Revenue | Operating Cash Flow | Net Income to Common Stock |
---|---|---|---|
2022-09-30 | 320.217 | 200.016 | 87.471 |
2022-06-30 | 330.659 | 262.991 | 94.274 |
2022-03-31 | 347.786 | 299.105 | 105.71 |
2021-12-31 | 362.032 | 173.035 | 115.422 |
2021-09-30 | 370.353 | 197.26 | 113.588 |
2021-06-30 | 375.41 | 174.944 | 112.767 |
HMST's Quality Factors
The “Quality” component of the POWR Ratings focuses on 31 different factors of a companies fundamentals and operational strength. Here are some key insights as we drill into the specifics of these quality attributes.- HMST has a Quality Grade of C, ranking ahead of 56.86% of graded US stocks.
- HMST's asset turnover comes in at 0.052 -- ranking 83rd of 430 Banking stocks.
- PNBK, HAFC, and UBCP are the stocks whose asset turnover ratios are most correlated with HMST.
The table below shows HMST's key quality metrics over time.
Period | Asset Turnover | Gross Margin | ROIC |
---|---|---|---|
2021-06-30 | 0.052 | 1 | 0.019 |
2021-03-31 | 0.050 | 1 | 0.017 |
2020-12-31 | 0.047 | 1 | 0.013 |
2020-09-30 | 0.043 | 1 | 0.010 |
2020-06-30 | 0.041 | 1 | 0.008 |
2020-03-31 | 0.040 | 1 | 0.005 |
HMST Price Target
For more insight on analysts targets of HMST, see our HMST price target page. And for a list of of all stocks sorted by upside potential based on analyst target price, see our Top Price Target page.
Average Price Target | $44.20 | Average Broker Recommendation | 1.9 (Hold) |
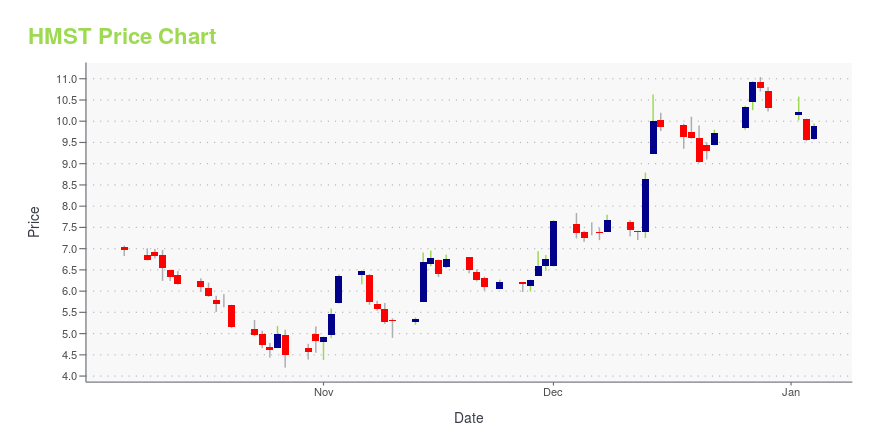
HMST Stock Price Chart Interactive Chart >
HMST Price/Volume Stats
Current price | $18.47 | 52-week high | $50.11 |
Prev. close | $18.15 | 52-week low | $16.98 |
Day low | $18.29 | Volume | 190,000 |
Day high | $18.76 | Avg. volume | 176,453 |
50-day MA | $25.17 | Dividend yield | 8.15% |
200-day MA | $29.96 | Market Cap | 346.40M |
HomeStreet, Inc. (HMST) Company Bio
HomeStreet Inc. provides various financial services primarily in the Pacific Northwest, California, and Hawaii. The company was founded in 1921 and is based in Seattle, Washington.
Latest HMST News From Around the Web
Below are the latest news stories about HOMESTREET INC that investors may wish to consider to help them evaluate HMST as an investment opportunity.
HomeStreet Announces Completion of the Purchase of Southern California BranchesSEATTLE, February 13, 2023--HomeStreet Announces Completion of the Purchase of Southern California Branches |
HomeStreet (NASDAQ:HMST) Is Due To Pay A Dividend Of $0.35HomeStreet, Inc. ( NASDAQ:HMST ) will pay a dividend of $0.35 on the 22nd of February. The dividend yield will be 4.8... |
The Consensus EPS Estimates For HomeStreet, Inc. (NASDAQ:HMST) Just Fell DramaticallyThe analysts covering HomeStreet, Inc. ( NASDAQ:HMST ) delivered a dose of negativity to shareholders today, by making... |
HomeStreet, Inc. (NASDAQ:HMST) Q4 2022 Earnings Call TranscriptHomeStreet, Inc. (NASDAQ:HMST) Q4 2022 Earnings Call Transcript January 30, 2023 Operator: Good afternoon. Thank you for attending today’s Fourth Quarter 2022 Earnings Release Call for HomeStreet Bank. Joining us on this call is Mark Mason, CEO, President, and Chairman of the Board. I would now like to pass the conference over to our host, […] |
Nasdaq Sinks Triple Digits Ahead Of Big Tech EarningsStocks are lower midday, with the Nasdaq Composite sporting a triple-digit loss. Investors are bracing for a possible interest rate hike this week. |
HMST Price Returns
1-mo | -27.45% |
3-mo | -31.49% |
6-mo | -34.61% |
1-year | -60.21% |
3-year | -5.40% |
5-year | -29.04% |
YTD | -32.21% |
2022 | -44.81% |
2021 | 57.69% |
2020 | 1.35% |
2019 | 60.15% |
2018 | -26.67% |
HMST Dividends
Ex-Dividend Date | Type | Payout Amount | Change | ||||||
---|---|---|---|---|---|---|---|---|---|
Loading, please wait... |
Continue Researching HMST
Here are a few links from around the web to help you further your research on HomeStreet Inc's stock as an investment opportunity:HomeStreet Inc (HMST) Stock Price | Nasdaq
HomeStreet Inc (HMST) Stock Quote, History and News - Yahoo Finance
HomeStreet Inc (HMST) Stock Price and Basic Information | MarketWatch
Loading social stream, please wait...