
Hennessy Advisors, Inc. (HNNA): Price and Financial Metrics
HNNA Price/Volume Stats
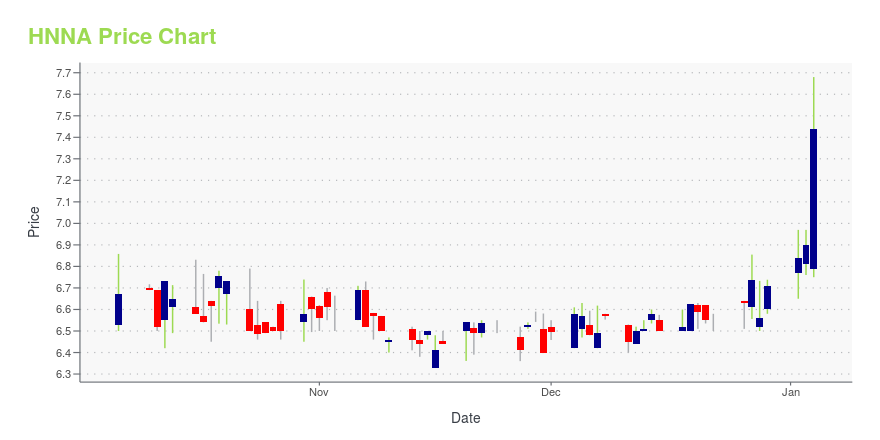
| Current price | $8.15 | 52-week high | $8.51 |
| Prev. close | $8.30 | 52-week low | $6.33 |
| Day low | $7.93 | Volume | 14,600 |
| Day high | $8.40 | Avg. volume | 6,535 |
| 50-day MA | $7.39 | Dividend yield | 6.77% |
| 200-day MA | $6.92 | Market Cap | 62.58M |
HNNA Stock Price Chart Interactive Chart >
Hennessy Advisors, Inc. (HNNA) Company Bio
Hennessy Advisors, Inc. is publicly owned investment manager. It provides its services to Hennessy Funds. The firm launches and manages equity, fixed income, and balanced mutual funds. It invests in the public equity and fixed income markets across the globe. The company was founded in 1989 and is based in Novato, California.
Latest HNNA News From Around the Web
Below are the latest news stories about HENNESSY ADVISORS INC that investors may wish to consider to help them evaluate HNNA as an investment opportunity.
One Hennessy Advisors Insider Raised Their Stake In The Previous YearFrom what we can see, insiders were net buyers in Hennessy Advisors, Inc.'s ( NASDAQ:HNNA ) during the past 12 months... |
Hennessy Advisors, Inc. Reports Annual EarningsHennessy Advisors, Inc. (Nasdaq: HNNA) today reported results for the fiscal year ended September 30, 2023. |
Hennessy Advisors, Inc. Acquires the CCM Small/Mid-Cap Impact Value FundHennessy Advisors, Inc. (NASDAQ: HNNA) today announced that it has completed the acquisition of assets related to the management of the CCM Small/Mid-Cap Impact Value Fund. As a result, the CCM Small/Mid-Cap Impact Value Fund will be reorganized into an existing exchange-traded fund ("ETF") managed by Hennessy Advisors, Inc. This acquisition represents approximately $12 million in assets. |
Don't Race Out To Buy Hennessy Advisors, Inc. (NASDAQ:HNNA) Just Because It's Going Ex-DividendReaders hoping to buy Hennessy Advisors, Inc. ( NASDAQ:HNNA ) for its dividend will need to make their move shortly, as... |
Hennessy Advisors (NASDAQ:HNNA) Is Paying Out A Dividend Of $0.1375The board of Hennessy Advisors, Inc. ( NASDAQ:HNNA ) has announced that it will pay a dividend on the 27th of November... |
HNNA Price Returns
| 1-mo | 14.79% |
| 3-mo | N/A |
| 6-mo | 17.50% |
| 1-year | 23.09% |
| 3-year | 6.46% |
| 5-year | 9.49% |
| YTD | 26.43% |
| 2023 | -13.76% |
| 2022 | -16.79% |
| 2021 | 32.50% |
| 2020 | -10.18% |
| 2019 | 5.55% |
HNNA Dividends
| Ex-Dividend Date | Type | Payout Amount | Change | ||||||
|---|---|---|---|---|---|---|---|---|---|
| Loading, please wait... | |||||||||
Continue Researching HNNA
Want to do more research on Hennessy Advisors Inc's stock and its price? Try the links below:Hennessy Advisors Inc (HNNA) Stock Price | Nasdaq
Hennessy Advisors Inc (HNNA) Stock Quote, History and News - Yahoo Finance
Hennessy Advisors Inc (HNNA) Stock Price and Basic Information | MarketWatch
Loading social stream, please wait...