Hologic Inc. (HOLX): Price and Financial Metrics
HOLX Price/Volume Stats
Current price | $78.66 | 52-week high | $87.88 |
Prev. close | $79.03 | 52-week low | $59.78 |
Day low | $78.48 | Volume | 1,376,900 |
Day high | $79.37 | Avg. volume | 1,497,607 |
50-day MA | $82.05 | Dividend yield | N/A |
200-day MA | $75.81 | Market Cap | 19.36B |
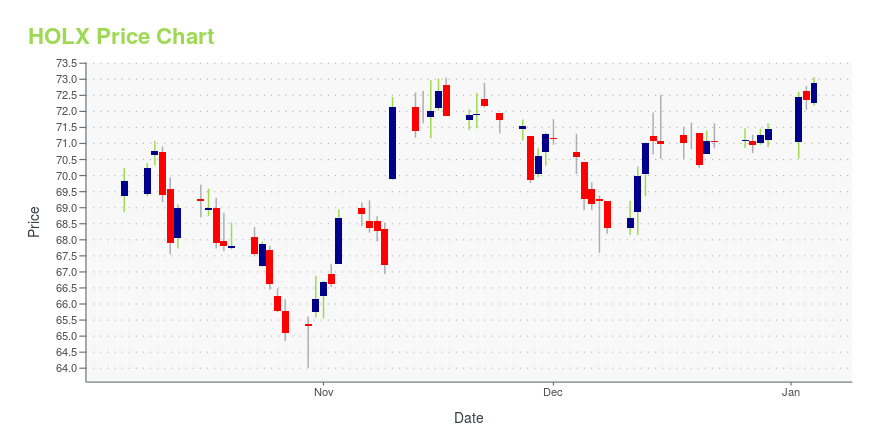
HOLX Stock Price Chart Interactive Chart >
HOLX POWR Grades
- Quality is the dimension where HOLX ranks best; there it ranks ahead of 95.62% of US stocks.
- The strongest trend for HOLX is in Value, which has been heading down over the past 179 days.
- HOLX ranks lowest in Momentum; there it ranks in the 6th percentile.
HOLX Stock Summary
- HOLX has a higher market value than 89.82% of US stocks; more precisely, its current market capitalization is $19,595,930,447.
- HOLOGIC INC's stock had its IPO on March 26, 1990, making it an older stock than 86.5% of US equities in our set.
- As for revenue growth, note that HOLX's revenue has grown -24.76% over the past 12 months; that beats the revenue growth of only 9.23% of US companies in our set.
- Stocks with similar financial metrics, market capitalization, and price volatility to HOLOGIC INC are QGEN, LOGI, HZNP, FOXF, and LFUS.
- Visit HOLX's SEC page to see the company's official filings. To visit the company's web site, go to www.hologic.com.
HOLX Valuation Summary
- HOLX's EV/EBIT ratio is 19.8; this is 65% higher than that of the median Healthcare stock.
- HOLX's price/sales ratio has moved up 3.7 over the prior 243 months.
Below are key valuation metrics over time for HOLX.
Stock | Date | P/S | P/B | P/E | EV/EBIT |
---|---|---|---|---|---|
HOLX | 2023-05-23 | 4.9 | 3.7 | 26.3 | 19.8 |
HOLX | 2023-05-22 | 5.0 | 3.8 | 26.7 | 20.1 |
HOLX | 2023-05-19 | 4.9 | 3.8 | 26.6 | 20.1 |
HOLX | 2023-05-18 | 4.9 | 3.8 | 26.5 | 20.0 |
HOLX | 2023-05-17 | 4.9 | 3.8 | 26.5 | 20.0 |
HOLX | 2023-05-16 | 4.9 | 3.8 | 26.6 | 20.0 |
HOLX Growth Metrics
- Its year over year revenue growth rate is now at 1.4%.
- The 4 year price growth rate now stands at 6.51%.
- The 2 year net income to common stockholders growth rate now stands at 242.78%.

The table below shows HOLX's growth in key financial areas (numbers in millions of US dollars).
Date | Revenue | Operating Cash Flow | Net Income to Common Stock |
---|---|---|---|
2022-12-31 | 4,465.8 | 1,814.9 | 990.2 |
2022-09-30 | 4,862.8 | 2,125.7 | 1,302 |
2022-06-30 | 5,226.1 | 2,422.5 | 1,512.1 |
2022-03-31 | 5,391.7 | 2,754.6 | 1,552.1 |
2021-12-31 | 5,493.6 | 2,244.6 | 1,716.3 |
2021-09-30 | 5,632.3 | 2,330.4 | 1,871.5 |
HOLX's Quality Factors
The “Quality” component of the POWR Ratings focuses on 31 different factors of a companies fundamentals and operational strength. Here are some key insights as we drill into the specifics of these quality attributes.- HOLX has a Quality Grade of B, ranking ahead of 93.54% of graded US stocks.
- HOLX's asset turnover comes in at 0.722 -- ranking 49th of 186 Medical Equipment stocks.
- SNN, TTOO, and AVGR are the stocks whose asset turnover ratios are most correlated with HOLX.
The table below shows HOLX's key quality metrics over time.
Period | Asset Turnover | Gross Margin | ROIC |
---|---|---|---|
2021-06-26 | 0.722 | 0.689 | 0.596 |
2021-03-27 | 0.719 | 0.689 | 0.566 |
2020-12-26 | 0.639 | 0.656 | 0.430 |
2020-09-26 | 0.557 | 0.590 | 0.268 |
2020-06-27 | 0.500 | 0.469 | 0.097 |
2020-03-28 | 0.510 | 0.458 | 0.087 |
HOLX Price Target
For more insight on analysts targets of HOLX, see our HOLX price target page. And for a list of of all stocks sorted by upside potential based on analyst target price, see our Top Price Target page.
Average Price Target | $85.50 | Average Broker Recommendation | 1.38 (Strong Buy) |
Hologic Inc. (HOLX) Company Bio
Hologic, Inc. is a medical technology company primarily focused on women’s health; it sells medical devices for diagnostics, surgery, and medical imaging. (Source:Wikipedia)
Latest HOLX News From Around the Web
Below are the latest news stories about HOLOGIC INC that investors may wish to consider to help them evaluate HOLX as an investment opportunity.
3 Reasons to Hold Inspire Medical (INSP) Stock in Your PortfolioInvestors continue to be optimistic about Inspire Medical (INSP) on the back of its product innovations. |
BD's (BDX) Latest Product Launch to Boost Research OutcomeBD's (BDX) latest cell sorting technology is expected to speed up the process of cell sorting and allow researchers to answer complex biological questions. |
Hologic (HOLX) Gets FDA Nod for Multiplexed Respiratory TestHologic's (HOLX) Panther Fusion SARS-CoV-2/Flu A/B/RSV assay is done using the fully-automated, high-throughput Panther Fusion system. |
What's in the Cards for Medtronic (MDT) in Q4 Earnings?Medtronic (MDT) is likely to have prioritized its R&D investments, which might get reflected in the fiscal Q4 results. |
Veeva Systems' (VEEV) New Launch to Improve Patient OutcomesVeeva Systems' (VEEV) new offering is expected to facilitate effective engagement with customers and KOLs for improved patient journeys. |
HOLX Price Returns
1-mo | -8.55% |
3-mo | -0.51% |
6-mo | 2.17% |
1-year | N/A |
3-year | 48.42% |
5-year | 107.60% |
YTD | 5.15% |
2022 | -2.29% |
2021 | 5.12% |
2020 | 39.49% |
2019 | 27.03% |
2018 | -3.86% |
Continue Researching HOLX
Want to see what other sources are saying about Hologic Inc's financials and stock price? Try the links below:Hologic Inc (HOLX) Stock Price | Nasdaq
Hologic Inc (HOLX) Stock Quote, History and News - Yahoo Finance
Hologic Inc (HOLX) Stock Price and Basic Information | MarketWatch
Loading social stream, please wait...