Robinhood Markets, Inc. (HOOD): Price and Financial Metrics
HOOD Price/Volume Stats
| Current price | $48.01 | 52-week high | $66.91 |
| Prev. close | $44.66 | 52-week low | $13.98 |
| Day low | $44.96 | Volume | 34,446,416 |
| Day high | $48.28 | Avg. volume | 39,432,309 |
| 50-day MA | $45.05 | Dividend yield | N/A |
| 200-day MA | $34.27 | Market Cap | 42.51B |
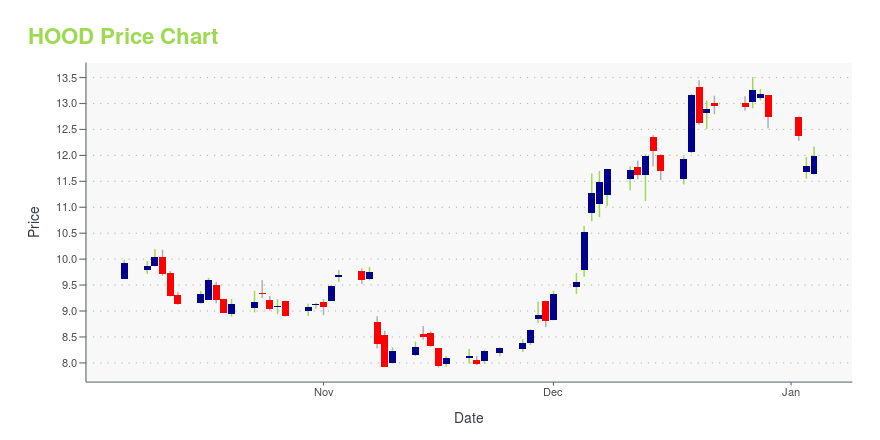
HOOD Stock Price Chart Interactive Chart >
Robinhood Markets, Inc. (HOOD) Company Bio
Robinhood Markets, Inc. operates financial services platform in the United States. Its platform allows users to invest in stocks, exchange-traded funds (ETFs), options, gold, and cryptocurrencies. The company also offers various learning and education solutions comprise Snacks, a digest of business news stories; Learn, which is a collection of approximately 650 articles, including guides, feature tutorials, and financial dictionary; Newsfeeds that offer access to free premium news from various sites, such as Barron's, Reuters, and The Wall Street Journal; and lists, which allow users to create custom watchlists to monitor securities, ETFs, and cryptocurrencies, as well as cash management services. Robinhood Markets, Inc. was incorporated in 2013 and is headquartered in Menlo Park, California.
HOOD Price Returns
| 1-mo | -0.29% |
| 3-mo | -6.08% |
| 6-mo | 77.42% |
| 1-year | 177.35% |
| 3-year | 362.08% |
| 5-year | N/A |
| YTD | 28.85% |
| 2024 | 192.46% |
| 2023 | 56.51% |
| 2022 | -54.17% |
| 2021 | N/A |
| 2020 | N/A |


Loading social stream, please wait...