
Hovnanian Enterprises, Inc. (HOV): Price and Financial Metrics
HOV Price/Volume Stats
| Current price | $216.02 | 52-week high | $224.52 |
| Prev. close | $204.09 | 52-week low | $65.22 |
| Day low | $207.31 | Volume | 104,800 |
| Day high | $224.52 | Avg. volume | 82,108 |
| 50-day MA | $157.10 | Dividend yield | N/A |
| 200-day MA | $139.33 | Market Cap | 1.29B |
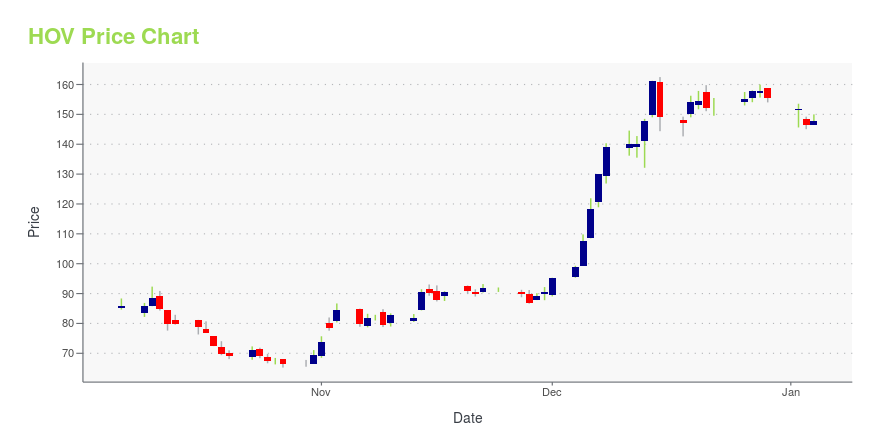
HOV Stock Price Chart Interactive Chart >
Hovnanian Enterprises, Inc. (HOV) Company Bio
Hovnanian Enterprises designs, constructs, markets, and sells residential homes in the United States. The company was founded in 1959 and is based in Red Bank, New Jersey.
Latest HOV News From Around the Web
Below are the latest news stories about HOVNANIAN ENTERPRISES INC that investors may wish to consider to help them evaluate HOV as an investment opportunity.
Director Vincent Pagano Sells Shares of Hovnanian Enterprises IncVincent Pagano, a director at Hovnanian Enterprises Inc, executed a sale of 3,862 shares in the company on December 20, 2023, according to a recent SEC Filing. |
Insider Sell Alert: Director Edward Kangas Sells 5,000 Shares of Hovnanian Enterprises Inc (HOV)Director Edward Kangas has recently made a significant stock transaction in Hovnanian Enterprises Inc (NYSE:HOV), selling 5,000 shares on December 15, 2023. |
K. Hovnanian®️ Introduces Locke Landing, a New LOOKS Community in Baltimore, MDBALTIMORE, Dec. 14, 2023 (GLOBE NEWSWIRE) -- K. Hovnanian Homes introduces Locke Landing, a new community of townhomes within the mixed-use development Baltimore Peninsula. Locke Landing is K. Hovnanian’s first Baltimore community to offer LOOKS: designer-curated collections of beautiful interiors. Buyers can choose from 4 unique interiors—Loft, Farmhouse, Classic or Elements—and enjoy cohesive style without the stress. "By whittling down an overwhelming number of design choices, we’ve been able |
K. Hovnanian® Introduces The Grove at Jackson Village, a New LOOKS Community in Fredericksburg, VAFREDERICKSBURG, Va., Dec. 13, 2023 (GLOBE NEWSWIRE) -- K. Hovnanian️ Homes introduces The Grove at Jackson Village, an 850-unit townhome community in Fredericksburg. This community offers LOOKS: a designer-curated collection of beautiful interiors. Buyers can choose between Loft, Farmhouse, Classic or Elements LOOKS, and enjoy cohesive style without the stress. "By whittling down an overwhelming number of design choices, we’ve been able to focus on making our 'LOOKS' stand out," said Alexander H |
These Two Players In Home Construction Are Reaching New HighsThis homebuilder stock hit a 52-week high on Friday and topped a buy zone. An air conditioning and heating stock also hit a buy point on Friday. |
HOV Price Returns
| 1-mo | 54.31% |
| 3-mo | 44.00% |
| 6-mo | 24.10% |
| 1-year | 101.53% |
| 3-year | 131.41% |
| 5-year | 3,384.19% |
| YTD | 38.81% |
| 2023 | 269.82% |
| 2022 | -66.94% |
| 2021 | 287.37% |
| 2020 | 57.45% |
| 2019 | 22.76% |
Continue Researching HOV
Want to do more research on Hovnanian Enterprises Inc's stock and its price? Try the links below:Hovnanian Enterprises Inc (HOV) Stock Price | Nasdaq
Hovnanian Enterprises Inc (HOV) Stock Quote, History and News - Yahoo Finance
Hovnanian Enterprises Inc (HOV) Stock Price and Basic Information | MarketWatch
Loading social stream, please wait...