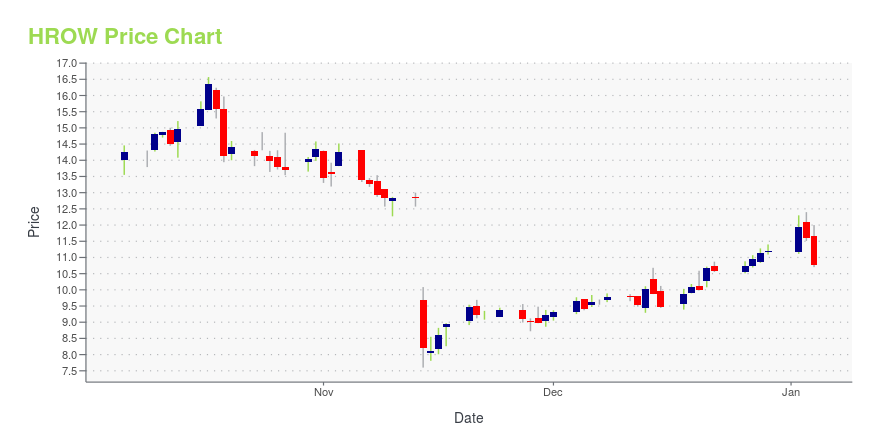
Harrow Health, Inc. (HROW): Price and Financial Metrics
HROW Price/Volume Stats
| Current price | $24.44 | 52-week high | $25.58 |
| Prev. close | $24.23 | 52-week low | $7.60 |
| Day low | $23.96 | Volume | 231,051 |
| Day high | $24.90 | Avg. volume | 446,529 |
| 50-day MA | $20.32 | Dividend yield | N/A |
| 200-day MA | $13.51 | Market Cap | 864.74M |
HROW Stock Price Chart Interactive Chart >
Harrow Health, Inc. (HROW) Company Bio
Harrow Health, Inc., together with its subsidiaries, develops, produces, and sells medications for unmet needs primarily in the United States. The company primarily provides ophthalmology based formulations to physicians and patients; and sterile and non-sterile compounded medications. It also develops and commercializes therapeutics for treating ocular surface diseases; and non-intravenous sedation and anesthesia therapeutics for human medical procedures in hospital, outpatient, and in-office settings. Its products portfolio includes topical eye drop drug candidates, including SURF-100 and SURF-200; SURF-300, an oral capsule for treating patients suffering from ocular surface diseases, and DED signs and symptoms; Klarity drops to protect and rehabilitate the ocular surface pathology for patients with DED; MELT-100, a drug that is administered sublingually for conscious sedation during cataract surgery; MAY-66 that is used for the treatment of symptoms associated with Peyronie's disease; MAY-44, a non-estrogen topical analgesic gel; and other drug candidates for rare diseases. In addition, the company engages in the development of MAY-88, an oral anhydrous extend release suspension of pentosan polysulfate sodium for interstitial cystitis. The company was formerly known as Imprimis Pharmaceuticals, Inc. and changed its name to Harrow Health, Inc. in December 2018. Harrow Health, Inc. was founded in 1998 and is headquartered in San Diego, California.
Latest HROW News From Around the Web
Below are the latest news stories about HARROW INC that investors may wish to consider to help them evaluate HROW as an investment opportunity.
7 Short-Squeeze Stocks That Are Screaming for SpeculationWhile the concept of short-squeeze stocks has been all the rage throughout most of the pandemic-disruption cycle, we may have been doing this all wrong. |
Harrow Completes Transfer of the TRIESENCE® New Drug ApplicationNASHVILLE, Tenn., November 29, 2023--Harrow (Nasdaq: HROW), a leading U.S. eyecare pharmaceutical company, today announced the completion of the transfer to Harrow of the New Drug Application (NDA) for TRIESENCE® (triamcinolone acetonide injectable suspension) 40 mg/mL, a synthetic corticosteroid indicated for the treatment of sympathetic ophthalmia, temporal arteritis, uveitis, and ocular inflammatory conditions unresponsive to topical corticosteroids as well as visualization during vitrectomy. |
Harrow to Present at Two Investor Conferences in NovemberNASHVILLE, Tenn., November 20, 2023--Harrow (Nasdaq: HROW), a leading U.S. eyecare pharmaceutical company, today announced that Mark L. Baum, Chief Executive Officer, and Andrew Boll, Chief Financial Officer, will participate in the following two upcoming conferences: |
Today’s Biggest Pre-Market Stock Movers: 10 Top Gainers and Losers on TuesdayWe're starting off Tuesday with a breakdown of all the biggest pre-market stock movers traders need to know about this morning! |
Harrow Health, Inc. (NASDAQ:HROW) Q3 2023 Earnings Call TranscriptHarrow Health, Inc. (NASDAQ:HROW) Q3 2023 Earnings Call Transcript November 13, 2023 Harrow Health, Inc. misses on earnings expectations. Reported EPS is $-0.13 EPS, expectations were $0.03. Operator: Good afternoon, and welcome to Harrow’s Third Quarter 2023 Earnings Conference Call. My name is Betsy, and I will be your operator for today’s call. At this […] |
HROW Price Returns
| 1-mo | 14.53% |
| 3-mo | 132.10% |
| 6-mo | 151.70% |
| 1-year | 12.21% |
| 3-year | 179.31% |
| 5-year | 212.93% |
| YTD | 118.21% |
| 2023 | -24.12% |
| 2022 | 70.83% |
| 2021 | 25.95% |
| 2020 | -11.83% |
| 2019 | 36.73% |
Continue Researching HROW
Here are a few links from around the web to help you further your research on Harrow Health Inc's stock as an investment opportunity:Harrow Health Inc (HROW) Stock Price | Nasdaq
Harrow Health Inc (HROW) Stock Quote, History and News - Yahoo Finance
Harrow Health Inc (HROW) Stock Price and Basic Information | MarketWatch


Loading social stream, please wait...