Heidrick & Struggles International, Inc. (HSII): Price and Financial Metrics
GET POWR RATINGS... FREE!
HSII POWR Grades
- HSII scores best on the Value dimension, with a Value rank ahead of 99.4% of US stocks.
- HSII's strongest trending metric is Quality; it's been moving down over the last 178 days.
- HSII ranks lowest in Growth; there it ranks in the 31st percentile.
HSII Stock Summary
- With a one year PEG ratio of 190.79, HEIDRICK & STRUGGLES INTERNATIONAL INC is expected to have a higher PEG ratio (a measure of how expensive a stock is relative to its expected earnings growth) than 85.68% of US stocks.
- The ratio of debt to operating expenses for HEIDRICK & STRUGGLES INTERNATIONAL INC is higher than it is for about only 14.8% of US stocks.
- In terms of volatility of its share price, HSII is more volatile than just 12.87% of stocks we're observing.
- If you're looking for stocks that are quantitatively similar to HEIDRICK & STRUGGLES INTERNATIONAL INC, a group of peers worth examining would be HYW, ELMD, RELL, LYTS, and CTG.
- HSII's SEC filings can be seen here. And to visit HEIDRICK & STRUGGLES INTERNATIONAL INC's official web site, go to www.heidrick.com.
HSII Valuation Summary
- In comparison to the median Industrials stock, HSII's price/earnings ratio is 60.73% lower, now standing at 7.5.
- Over the past 243 months, HSII's EV/EBIT ratio has gone up 4.3.
Below are key valuation metrics over time for HSII.
Stock | Date | P/S | P/B | P/E | EV/EBIT |
---|---|---|---|---|---|
HSII | 2023-03-17 | 0.6 | 1.5 | 7.5 | 3.0 |
HSII | 2023-03-16 | 0.6 | 1.5 | 7.8 | 3.2 |
HSII | 2023-03-15 | 0.6 | 1.5 | 7.7 | 3.1 |
HSII | 2023-03-14 | 0.6 | 1.5 | 7.8 | 3.2 |
HSII | 2023-03-13 | 0.6 | 1.5 | 7.8 | 3.1 |
HSII | 2023-03-10 | 0.6 | 1.5 | 7.9 | 3.2 |
HSII Growth Metrics
- Its 3 year cash and equivalents growth rate is now at 134.22%.
- Its 4 year price growth rate is now at 13.09%.
- Its 3 year price growth rate is now at -0.68%.

The table below shows HSII's growth in key financial areas (numbers in millions of US dollars).
Date | Revenue | Operating Cash Flow | Net Income to Common Stock |
---|---|---|---|
2022-12-31 | 1,083.586 | 119.288 | 79.486 |
2022-09-30 | 1,132.11 | 165.577 | 75.919 |
2022-06-30 | 1,139.154 | 144.232 | 79.591 |
2022-03-31 | 1,099.28 | 151.776 | 76.207 |
2021-12-31 | 1,008.474 | 271.401 | 72.572 |
2021-09-30 | 883.468 | 161.034 | 65.633 |
HSII's Quality Factors
The “Quality” component of the POWR Ratings focuses on 31 different factors of a companies fundamentals and operational strength. Here are some key insights as we drill into the specifics of these quality attributes.- HSII has a Quality Grade of B, ranking ahead of 94.71% of graded US stocks.
- HSII's asset turnover comes in at 1.088 -- ranking 115th of 563 Business Services stocks.
- RCMT, CTXS, and EXLS are the stocks whose asset turnover ratios are most correlated with HSII.
The table below shows HSII's key quality metrics over time.
Period | Asset Turnover | Gross Margin | ROIC |
---|---|---|---|
2021-09-30 | 1.088 | 0.957 | 0.491 |
2021-06-30 | 1.012 | 0.975 | 0.121 |
2021-03-31 | 0.874 | 0.992 | -0.074 |
2020-12-31 | 0.817 | 0.988 | -0.094 |
2020-09-30 | 0.831 | 0.983 | -0.082 |
2020-06-30 | 0.867 | 0.979 | 0.065 |
HSII Price Target
For more insight on analysts targets of HSII, see our HSII price target page. And for a list of of all stocks sorted by upside potential based on analyst target price, see our Top Price Target page.
Average Price Target | $51.33 | Average Broker Recommendation | 1.33 (Strong Buy) |
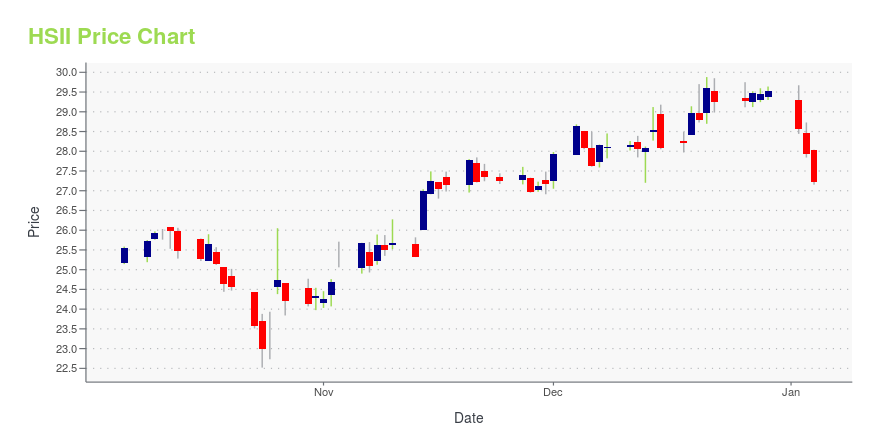
HSII Stock Price Chart Interactive Chart >
HSII Price/Volume Stats
Current price | $30.56 | 52-week high | $42.17 |
Prev. close | $30.13 | 52-week low | $22.79 |
Day low | $30.52 | Volume | 50,414 |
Day high | $31.24 | Avg. volume | 127,367 |
50-day MA | $30.93 | Dividend yield | 1.92% |
200-day MA | $29.74 | Market Cap | 606.95M |
Heidrick & Struggles International, Inc. (HSII) Company Bio
Heidrick & Struggles provides executive search, culture shaping, and leadership consulting services on a retained basis to businesses and business leaders worldwide. The company was founded in 1953 and is based in Chicago, Illinois.
Latest HSII News From Around the Web
Below are the latest news stories about HEIDRICK & STRUGGLES INTERNATIONAL INC that investors may wish to consider to help them evaluate HSII as an investment opportunity.
Is Now The Time To Put Heidrick & Struggles International (NASDAQ:HSII) On Your Watchlist?Investors are often guided by the idea of discovering 'the next big thing', even if that means buying 'story stocks... |
4 Staffing Stocks to Watch on Solid February Job AdditionsStocks like HireQuest, Inc. (HQI), Kforce Inc. (KFRC), Heidrick & Struggles International, Inc. (HSII) and ManpowerGroup Inc. (MAN) are likely to benefit on robust job additions to the U.S. economy. |
HEIDRICK & STRUGGLES TO PRESENT AT SIDOTI VIRTUAL INVESTOR CONFERENCEHeidrick & Struggles (Nasdaq: HSII) today announced that Chief Financial Officer Mark Harris will participate virtually in investor meetings on Wednesday, March 22, 2023 and host a presentation at the Sidoti Virtual Investor Conference on Thursday, March 23, 2023. The presentation is scheduled from 10:45 a.m. to 11:15 a.m. Eastern Time. Please visit Events & Presentations in the Investor Relations section of the Company's website or click here to access the live webcast and replay of the present |
Heidrick & Struggles Adds Executive Search Consultant in the AmericasHeidrick & Struggles (Nasdaq: HSII), a premier provider of global leadership advisory and on-demand talent solutions, is pleased to announce that Elizabeth Linhart has joined the Dallas office as a Principal and Member of the Industrial Practice. Elizabeth brings experience in identifying emerging leaders and talented professionals for industrial clients, including the oil and gas sector. |
Heidrick & Struggles Adds Executive Search Consultant in Asia PacificHeidrick & Struggles (Nasdaq: HSII), a premier provider of global leadership advisory and on-demand talent solutions, added a partner to its Executive Search business in Asia Pacific in February 2023. |
HSII Price Returns
1-mo | -2.36% |
3-mo | 9.95% |
6-mo | 15.95% |
1-year | -23.18% |
3-year | 51.65% |
5-year | 3.31% |
YTD | 9.75% |
2022 | -34.86% |
2021 | 51.02% |
2020 | -7.13% |
2019 | 6.13% |
2018 | 28.96% |
HSII Dividends
Ex-Dividend Date | Type | Payout Amount | Change | ||||||
---|---|---|---|---|---|---|---|---|---|
Loading, please wait... |
Continue Researching HSII
Want to do more research on Heidrick & Struggles International Inc's stock and its price? Try the links below:Heidrick & Struggles International Inc (HSII) Stock Price | Nasdaq
Heidrick & Struggles International Inc (HSII) Stock Quote, History and News - Yahoo Finance
Heidrick & Struggles International Inc (HSII) Stock Price and Basic Information | MarketWatch
Loading social stream, please wait...