Healthcare Trust of America, Inc. (HTA): Price and Financial Metrics
GET POWR RATINGS... FREE!
HTA POWR Grades
- Momentum is the dimension where HTA ranks best; there it ranks ahead of 84.89% of US stocks.
- HTA's strongest trending metric is Momentum; it's been moving up over the last 179 days.
- HTA ranks lowest in Value; there it ranks in the 14th percentile.
HTA Stock Summary
- With a one year PEG ratio of 253.04, Healthcare Trust Of America Inc is expected to have a higher PEG ratio (a measure of how expensive a stock is relative to its expected earnings growth) than 89.95% of US stocks.
- With a price/earnings ratio of 74.84, Healthcare Trust Of America Inc P/E ratio is greater than that of about 90.58% of stocks in our set with positive earnings.
- Of note is the ratio of Healthcare Trust Of America Inc's sales and general administrative expense to its total operating expenses; merely 5.13% of US stocks have a lower such ratio.
- Stocks with similar financial metrics, market capitalization, and price volatility to Healthcare Trust Of America Inc are CUZ, SBRA, PAA, KRG, and CUBE.
- Visit HTA's SEC page to see the company's official filings. To visit the company's web site, go to www.htareit.com.
HTA Valuation Summary
- In comparison to the median Real Estate stock, HTA's EV/EBIT ratio is 49.54% higher, now standing at 57.5.
- HTA's price/sales ratio has moved up 0.7 over the prior 112 months.
- Over the past 112 months, HTA's price/earnings ratio has gone down 659.7.
Below are key valuation metrics over time for HTA.
Stock | Date | P/S | P/B | P/E | EV/EBIT |
---|---|---|---|---|---|
HTA | 2021-09-02 | 9.0 | 2.2 | 84.0 | 57.5 |
HTA | 2021-09-01 | 9.0 | 2.2 | 83.5 | 57.3 |
HTA | 2021-08-31 | 8.8 | 2.1 | 81.7 | 56.5 |
HTA | 2021-08-30 | 8.8 | 2.1 | 81.4 | 56.3 |
HTA | 2021-08-27 | 8.6 | 2.1 | 80.0 | 55.7 |
HTA | 2021-08-26 | 8.5 | 2.1 | 78.8 | 55.1 |
HTA Growth Metrics
- The year over year cash and equivalents growth rate now stands at -85.06%.
- Its 3 year revenue growth rate is now at 67.16%.
- Its 2 year cash and equivalents growth rate is now at 221.26%.

The table below shows HTA's growth in key financial areas (numbers in millions of US dollars).
Date | Revenue | Operating Cash Flow | Net Income to Common Stock |
---|---|---|---|
2021-12-31 | 767.073 | 385.616 | 98.016 |
2021-09-30 | 758.388 | 389.912 | 109.768 |
2021-06-30 | 754.452 | 396.706 | 81.269 |
2021-03-31 | 744.682 | 377.894 | 56.747 |
2020-12-31 | 738.965 | 387.962 | 52.618 |
2020-09-30 | 728.26 | 371.68 | 33.481 |
HTA's Quality Factors
The “Quality” component of the POWR Ratings focuses on 31 different factors of a companies fundamentals and operational strength. Here are some key insights as we drill into the specifics of these quality attributes.- HTA has a Quality Grade of C, ranking ahead of 28.22% of graded US stocks.
- HTA's asset turnover comes in at 0.112 -- ranking 179th of 442 Trading stocks.
- SNEX, PLYM, and PSB are the stocks whose asset turnover ratios are most correlated with HTA.
The table below shows HTA's key quality metrics over time.
Period | Asset Turnover | Gross Margin | ROIC |
---|---|---|---|
2021-06-30 | 0.112 | 0.694 | 0.018 |
2021-03-31 | 0.111 | 0.692 | 0.015 |
2020-12-31 | 0.109 | 0.693 | 0.015 |
2020-09-30 | 0.108 | 0.693 | 0.013 |
2020-06-30 | 0.108 | 0.693 | 0.014 |
2020-03-31 | 0.109 | 0.694 | 0.014 |
HTA Price Target
For more insight on analysts targets of HTA, see our HTA price target page. And for a list of of all stocks sorted by upside potential based on analyst target price, see our Top Price Target page.
Average Price Target | $31.04 | Average Broker Recommendation | 1.73 (Moderate Buy) |
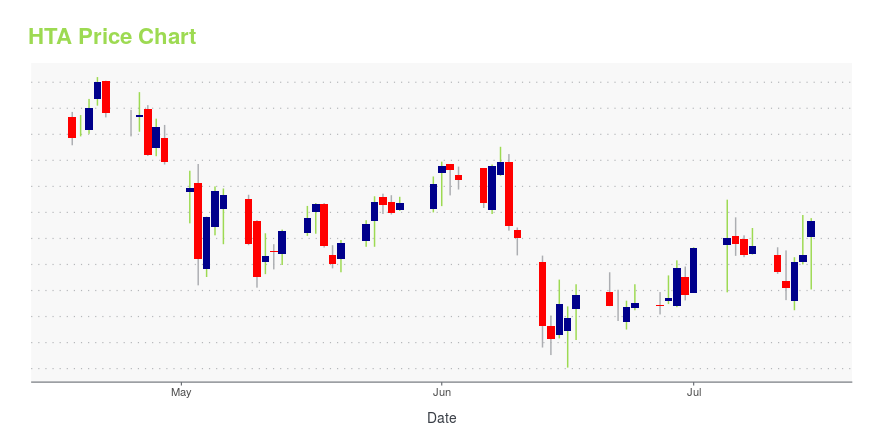
HTA Stock Price Chart Interactive Chart >
HTA Price/Volume Stats
Current price | $28.92 | 52-week high | $34.83 |
Prev. close | $28.51 | 52-week low | $26.36 |
Day low | $28.35 | Volume | 1,664,300 |
Day high | $28.97 | Avg. volume | 3,972,206 |
50-day MA | $30.61 | Dividend yield | 4.5% |
200-day MA | $31.61 | Market Cap | 6.62B |
Healthcare Trust of America, Inc. (HTA) Company Bio
Healthcare Trust of America acquires, owns, and operates medical office buildings. The company was founded in 2006 and is based in Scottsdale, Arizona.
Latest HTA News From Around the Web
Below are the latest news stories about Healthcare Trust Of America Inc that investors may wish to consider to help them evaluate HTA as an investment opportunity.
Iron Mountain (IRM) Surpasses Q4 FFO and Revenue EstimatesIron Mountain (IRM) delivered FFO and revenue surprises of 4.23% and 0.99%, respectively, for the quarter ended December 2021. Do the numbers hold clues to what lies ahead for the stock? |
Healthcare Trust of America Q4 2021 Earnings Preview (NYSE:HTA)Healthcare Trust of America (NYSE:HTA) is scheduled to announce Q4 earnings results on Wednesday, February 23rd, after market close.The consensus EPS Estimate is $0.45 (+4.7% Y/Y) and |
Healthcare Trust of America, Inc. Reschedules 2021 Fourth Quarter Financial Results and Conference CallHealthcare Trust of America, Inc. (the "Company") today announced that it has rescheduled the release of its fourth quarter 2021 financial results and investor conference call previously set for February 23 and 24, 2022, respectively. The earnings release will now be issued on Tuesday March 1, 2022, before the market opens, and the Company will host an investor conference call at 11:00 A.M. ET that same day. |
Healthcare Trust of America: Still No CEO, Possible M&ANo summary available. |
Healthcare Trust of America, Inc. Sets Dates to Report 2021 Fourth Quarter Financial Results and Host Conference CallSCOTTSDALE, Ariz. , Feb. 7, 2022 /PRNewswire/ -- Healthcare Trust of America, Inc. (the "Company") (NYSE: HTA ), announced today that on Wednesday, February 23, 2022 , after the market closes, HTA will report its financial results for the three months ending December 31 , 2021. The Company plans to host a conference call and webcast on Thursday, February 24, 2022 at 11:00 a.m. Eastern Time to review its financial performance and operating results for the three months ending December 31, 2021 . Conference Call and Webcast: Domestic: (844) 200-6205 / International: (929) 526-1599 / Canada : (833) 950-0062 Access Code: 618902 Webcast: www.htareit.com under the Investor Relations tab Replay: Domestic: (866) 813-9403 / International: +44 (204) 525-0658 / Canada : (226) 828-7578 Access Code: ... |
HTA Price Returns
1-mo | -9.65% |
3-mo | -3.65% |
6-mo | -14.06% |
1-year | 8.69% |
3-year | 17.45% |
5-year | 14.18% |
YTD | -11.62% |
2021 | 26.94% |
2020 | -5.58% |
2019 | 24.98% |
2018 | -11.69% |
2017 | 7.37% |
HTA Dividends
Ex-Dividend Date | Type | Payout Amount | Change | ||||||
---|---|---|---|---|---|---|---|---|---|
Loading, please wait... |
Continue Researching HTA
Here are a few links from around the web to help you further your research on Healthcare Trust Of America Inc's stock as an investment opportunity:Healthcare Trust Of America Inc (HTA) Stock Price | Nasdaq
Healthcare Trust Of America Inc (HTA) Stock Quote, History and News - Yahoo Finance
Healthcare Trust Of America Inc (HTA) Stock Price and Basic Information | MarketWatch
Loading social stream, please wait...