Heritage Commerce Corp (HTBK): Price and Financial Metrics
GET POWR RATINGS... FREE!
HTBK POWR Grades
- Growth is the dimension where HTBK ranks best; there it ranks ahead of 87.37% of US stocks.
- HTBK's strongest trending metric is Stability; it's been moving down over the last 177 days.
- HTBK ranks lowest in Quality; there it ranks in the 10th percentile.
HTBK Stock Summary
- The capital turnover (annual revenue relative to shareholder's equity) for HTBK is 0.29 -- better than merely 22.17% of US stocks.
- With a price/sales ratio of 4.28, HERITAGE COMMERCE CORP has a higher such ratio than 72.05% of stocks in our set.
- HTBK's equity multiplier -- a measure of assets relative to shareholders'equity -- is greater than that of 88.87% of US stocks.
- If you're looking for stocks that are quantitatively similar to HERITAGE COMMERCE CORP, a group of peers worth examining would be HTBI, SSB, COLB, IBTX, and CATY.
- Visit HTBK's SEC page to see the company's official filings. To visit the company's web site, go to www.heritagecommercecorp.com.
HTBK Valuation Summary
- HTBK's price/earnings ratio is 12.8; this is 8.47% higher than that of the median Financial Services stock.
- HTBK's EV/EBIT ratio has moved up 7 over the prior 243 months.
Below are key valuation metrics over time for HTBK.
Stock | Date | P/S | P/B | P/E | EV/EBIT |
---|---|---|---|---|---|
HTBK | 2023-02-03 | 4.3 | 1.3 | 12.8 | 1.5 |
HTBK | 2023-02-02 | 4.2 | 1.2 | 12.6 | 1.3 |
HTBK | 2023-02-01 | 4.2 | 1.2 | 12.4 | 1.2 |
HTBK | 2023-01-31 | 4.2 | 1.2 | 12.3 | 1.1 |
HTBK | 2023-01-30 | 4.1 | 1.2 | 12.0 | 0.9 |
HTBK | 2023-01-27 | 4.1 | 1.2 | 12.1 | 1.0 |
HTBK Growth Metrics
- The 4 year net income to common stockholders growth rate now stands at 12.58%.
- The 5 year cash and equivalents growth rate now stands at 54.04%.
- The 5 year net cashflow from operations growth rate now stands at 55.11%.

The table below shows HTBK's growth in key financial areas (numbers in millions of US dollars).
Date | Revenue | Operating Cash Flow | Net Income to Common Stock |
---|---|---|---|
2022-09-30 | 176.756 | 60.157 | 59.721 |
2022-06-30 | 168.044 | 62.262 | 55.37 |
2022-03-31 | 161.424 | 63.376 | 49.362 |
2021-12-31 | 158.947 | 56.849 | 47.7 |
2021-09-30 | 155.022 | 62.261 | 45.358 |
2021-06-30 | 150.481 | 53.334 | 42.837 |
HTBK's Quality Factors
The “Quality” component of the POWR Ratings focuses on 31 different factors of a companies fundamentals and operational strength. Here are some key insights as we drill into the specifics of these quality attributes.- HTBK has a Quality Grade of D, ranking ahead of 24.45% of graded US stocks.
- HTBK's asset turnover comes in at 0.031 -- ranking 356th of 430 Banking stocks.
- NTRS, ACNB, and IBTX are the stocks whose asset turnover ratios are most correlated with HTBK.
The table below shows HTBK's key quality metrics over time.
Period | Asset Turnover | Gross Margin | ROIC |
---|---|---|---|
2021-06-30 | 0.031 | 1 | 0.017 |
2021-03-31 | 0.032 | 1 | 0.018 |
2020-12-31 | 0.031 | 1 | 0.014 |
2020-09-30 | 0.032 | 1 | 0.012 |
2020-06-30 | 0.034 | 1 | 0.012 |
2020-03-31 | 0.037 | 1 | 0.014 |
HTBK Price Target
For more insight on analysts targets of HTBK, see our HTBK price target page. And for a list of of all stocks sorted by upside potential based on analyst target price, see our Top Price Target page.
Average Price Target | $13.00 | Average Broker Recommendation | 1.5 (Moderate Buy) |
HTBK Stock Price Chart Interactive Chart >
HTBK Price/Volume Stats
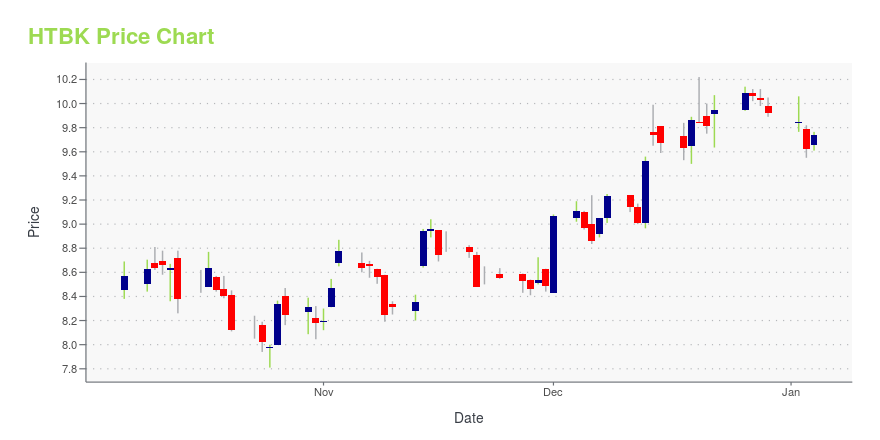
Current price | $12.58 | 52-week high | $14.87 |
Prev. close | $12.45 | 52-week low | $10.42 |
Day low | $12.41 | Volume | 104,347 |
Day high | $12.58 | Avg. volume | 175,181 |
50-day MA | $13.05 | Dividend yield | 4.18% |
200-day MA | $12.17 | Market Cap | 763.85M |
Heritage Commerce Corp (HTBK) Company Bio
Heritage Commerce Corp provides commercial and personal banking services to customers in California. The company was founded in 1993 and is based in San Jose, California.
Latest HTBK News From Around the Web
Below are the latest news stories about HERITAGE COMMERCE CORP that investors may wish to consider to help them evaluate HTBK as an investment opportunity.
Tuesday Is Your Last Chance To Buy Heritage Commerce Before The Dividend PayoutTuesday marks the last chance for investors to receive the next dividend payout from Heritage Commerce (NASDAQ: HTBK ). What''s Happening The company announced on Thursday that it would pay shareholders a quarterly dividend of 13 cents per share. On Wednesday, Heritage Commerce will go ex-dividend, meaning the stock will trade lower to reflect that payout. In other words, the … Full story available on Benzinga.com |
Heritage Commerce Full Year 2022 Earnings: In Line With ExpectationsHeritage Commerce ( NASDAQ:HTBK ) Full Year 2022 Results Key Financial Results Revenue: US$189.2m (up 19% from FY... |
Heritage Commerce Corp Earns Record $20.8 Million for the Fourth Quarter of 2022, and Record $66.6 Million for Full Year 2022SAN JOSE, Calif., Jan. 26, 2023 (GLOBE NEWSWIRE) -- Heritage Commerce Corp (NASDAQ: HTBK ) , the holding company (the "Company") for Heritage Bank of Commerce (the "Bank"), today announced fourth quarter 2022 net income increased 49% to $20.8 million, or $0.34 per average diluted common share, compared to $14.0 million, or $0.23 per average diluted common share, for the fourth quarter of 2021, and increased 15% from $18.1 million, or $0.30 per average diluted common share, for the third quarter of 2022. For the year ended December 31, 2022, net income increased 40% to $66.6 million, or $1.09 per average diluted common share, compared to $47.7 million, or $0.79 per average diluted common share, for the year ended December 31, 2021. All results are unaudited. "Our quarterly results were a... |
Heritage Commerce GAAP EPS of $0.34 in-line, revenue of $54.51M misses by $0.07M (NASDAQ:HTBK)Heritage Commerce press release (HTBK): Q4 GAAP EPS of $0.34 in-line.Revenue of $54.51M (+33.2% Y/Y) misses by $0.07M. |
Heritage Commerce (HTBK) Surpasses Q4 Earnings and Revenue EstimatesHeritage Commerce (HTBK) delivered earnings and revenue surprises of 3.03% and 2.78%, respectively, for the quarter ended December 2022. Do the numbers hold clues to what lies ahead for the stock? |
HTBK Price Returns
1-mo | -3.75% |
3-mo | -9.04% |
6-mo | 6.50% |
1-year | 7.05% |
3-year | 24.56% |
5-year | 1.65% |
YTD | -3.23% |
2022 | 13.59% |
2021 | 41.02% |
2020 | -26.22% |
2019 | 17.61% |
2018 | -23.82% |
HTBK Dividends
Ex-Dividend Date | Type | Payout Amount | Change | ||||||
---|---|---|---|---|---|---|---|---|---|
Loading, please wait... |
Continue Researching HTBK
Here are a few links from around the web to help you further your research on Heritage Commerce Corp's stock as an investment opportunity:Heritage Commerce Corp (HTBK) Stock Price | Nasdaq
Heritage Commerce Corp (HTBK) Stock Quote, History and News - Yahoo Finance
Heritage Commerce Corp (HTBK) Stock Price and Basic Information | MarketWatch
Loading social stream, please wait...