
HubSpot Inc. (HUBS): Price and Financial Metrics
HUBS Price/Volume Stats
| Current price | $492.72 | 52-week high | $693.85 |
| Prev. close | $495.76 | 52-week low | $407.23 |
| Day low | $491.60 | Volume | 930,327 |
| Day high | $501.10 | Avg. volume | 640,290 |
| 50-day MA | $565.50 | Dividend yield | N/A |
| 200-day MA | $562.63 | Market Cap | 25.11B |
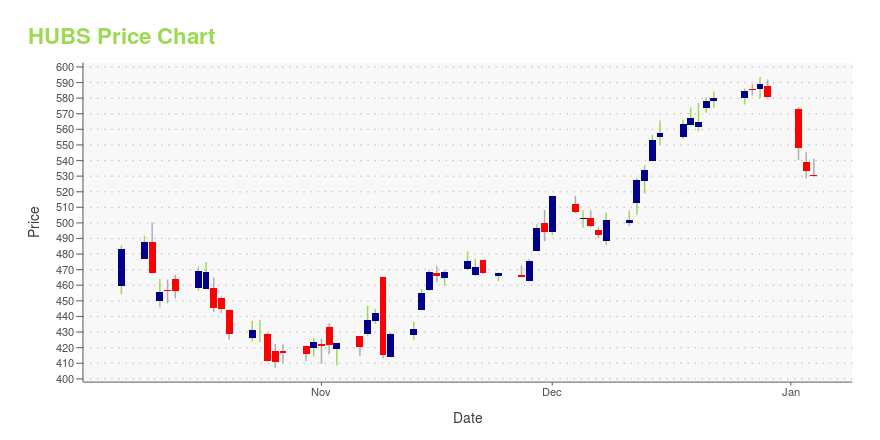
HUBS Stock Price Chart Interactive Chart >
HubSpot Inc. (HUBS) Company Bio
HubSpot is an American developer and marketer of software products for inbound marketing, sales, and customer service. Hubspot was founded by Brian Halligan and Dharmesh Shah in 2006. (Source:Wikipedia)
Latest HUBS News From Around the Web
Below are the latest news stories about HUBSPOT INC that investors may wish to consider to help them evaluate HUBS as an investment opportunity.
3 Disruptive Tech Stocks Set to Soar by 2025In the tech sector, three trailblazing entities stand at the forefront, wielding disruptive prowess set to redefine industry norms. |
Why HubSpot (HUBS) Outpaced the Stock Market TodayThe latest trading day saw HubSpot (HUBS) settling at $579.90, representing a +0.27% change from its previous close. |
Salesforce And Adobe Rival Supercharges AI — And New BreakoutAs Salesforce and Adobe tap artificial intelligence, fellow CRM leader HubSpot powers AI and 130% growth, lifting HUBS stock into buy range. |
Top AI stock picks for 2024: Two analysts share their ideas2023 was the year of AI. OpenAI's ChatGPT took the world by storm and shares of AI chipmaker Nvidia (NVDA) soared. So how should investors play the sector in 2024? Evercore ISI Head of Internet Research Mark Mahaney and Piper Sandler Equity Research Analyst Brent Bracelin give Yahoo Finance Live their best ideas. Mahaney likes Amazon (AMZN), Alphabet (GOOG, GOOGL), and Meta Platforms (META). Why? "They've got so much data to work with and they also have the capital to be able to invest," Mahaney explains, adding that these companies were investing in AI long before 2023. Bracelin is favoring Microsoft (MSFT) saying this is Microsoft's "iPhone moment." Bracelin also likes Adobe (ADBE) and HubSpot (HUBS) for how they plan to monetize their AI products. Watch the video above to find out ... |
Shareholders have faith in loss-making HubSpot (NYSE:HUBS) as stock climbs 12% in past week, taking five-year gain to 355%We think all investors should try to buy and hold high quality multi-year winners. While not every stock performs well... |
HUBS Price Returns
| 1-mo | -13.33% |
| 3-mo | -21.93% |
| 6-mo | -16.31% |
| 1-year | -10.15% |
| 3-year | -15.90% |
| 5-year | 166.08% |
| YTD | -15.13% |
| 2023 | 100.79% |
| 2022 | -56.14% |
| 2021 | 66.27% |
| 2020 | 150.12% |
| 2019 | 26.06% |
Continue Researching HUBS
Want to see what other sources are saying about Hubspot Inc's financials and stock price? Try the links below:Hubspot Inc (HUBS) Stock Price | Nasdaq
Hubspot Inc (HUBS) Stock Quote, History and News - Yahoo Finance
Hubspot Inc (HUBS) Stock Price and Basic Information | MarketWatch
Loading social stream, please wait...