Huntsman Corporation (HUN): Price and Financial Metrics
GET POWR RATINGS... FREE!
HUN POWR Grades
- HUN scores best on the Value dimension, with a Value rank ahead of 97.26% of US stocks.
- The strongest trend for HUN is in Quality, which has been heading up over the past 179 days.
- HUN ranks lowest in Stability; there it ranks in the 38th percentile.
HUN Stock Summary
- HUN's current price/earnings ratio is 7.85, which is higher than only 16.46% of US stocks with positive earnings.
- With a year-over-year growth in debt of -23.72%, Huntsman CORP's debt growth rate surpasses only 17.13% of about US stocks.
- Shareholder yield, a measure of how much is returned to shareholders via dividends and share repurchases, for HUN comes in at 11.1% -- higher than that of 85.49% of stocks in our set.
- If you're looking for stocks that are quantitatively similar to Huntsman CORP, a group of peers worth examining would be CW, LIQT, VNT, PLPC, and BC.
- Visit HUN's SEC page to see the company's official filings. To visit the company's web site, go to www.huntsman.com.
HUN Valuation Summary
- In comparison to the median Basic Materials stock, HUN's EV/EBIT ratio is 42.11% lower, now standing at 8.8.
- HUN's price/sales ratio has moved up 0.3 over the prior 202 months.
- HUN's EV/EBIT ratio has moved down 26.3 over the prior 202 months.
Below are key valuation metrics over time for HUN.
Stock | Date | P/S | P/B | P/E | EV/EBIT |
---|---|---|---|---|---|
HUN | 2021-09-03 | 0.8 | 1.6 | 9.4 | 8.8 |
HUN | 2021-09-02 | 0.8 | 1.6 | 9.5 | 8.9 |
HUN | 2021-09-01 | 0.8 | 1.6 | 9.3 | 8.8 |
HUN | 2021-08-31 | 0.8 | 1.6 | 9.3 | 8.7 |
HUN | 2021-08-30 | 0.8 | 1.6 | 9.3 | 8.7 |
HUN | 2021-08-27 | 0.8 | 1.6 | 9.3 | 8.7 |
HUN Growth Metrics
- Its year over year revenue growth rate is now at -12.19%.
- The 5 year price growth rate now stands at 1.33%.
- The 2 year net cashflow from operations growth rate now stands at -33.8%.

The table below shows HUN's growth in key financial areas (numbers in millions of US dollars).
Date | Revenue | Operating Cash Flow | Net Income to Common Stock |
---|---|---|---|
2021-12-31 | 8,453 | 952 | 1,045 |
2021-09-30 | 7,814 | 328 | 791 |
2021-06-30 | 7,039 | 225 | 630 |
2021-03-31 | 6,262 | 312 | 412 |
2020-12-31 | 6,018 | 253 | 1,034 |
2020-09-30 | 6,007 | 321 | 994 |
HUN's Quality Factors
The “Quality” component of the POWR Ratings focuses on 31 different factors of a companies fundamentals and operational strength. Here are some key insights as we drill into the specifics of these quality attributes.- HUN has a Quality Grade of C, ranking ahead of 45.94% of graded US stocks.
- HUN's asset turnover comes in at 0.838 -- ranking 25th of 89 Chemicals stocks.
- AVNT, MTX, and ROG are the stocks whose asset turnover ratios are most correlated with HUN.
The table below shows HUN's key quality metrics over time.
Period | Asset Turnover | Gross Margin | ROIC |
---|---|---|---|
2021-06-30 | 0.838 | 0.208 | 0.122 |
2021-03-31 | 0.754 | 0.191 | 0.085 |
2020-12-31 | 0.721 | 0.183 | 0.174 |
2020-09-30 | 0.728 | 0.174 | 0.133 |
2020-06-30 | 0.749 | 0.179 | 0.127 |
2020-03-31 | 0.854 | 0.194 | 0.148 |
HUN Price Target
For more insight on analysts targets of HUN, see our HUN price target page. And for a list of of all stocks sorted by upside potential based on analyst target price, see our Top Price Target page.
Average Price Target | $35.71 | Average Broker Recommendation | 1.5 (Moderate Buy) |
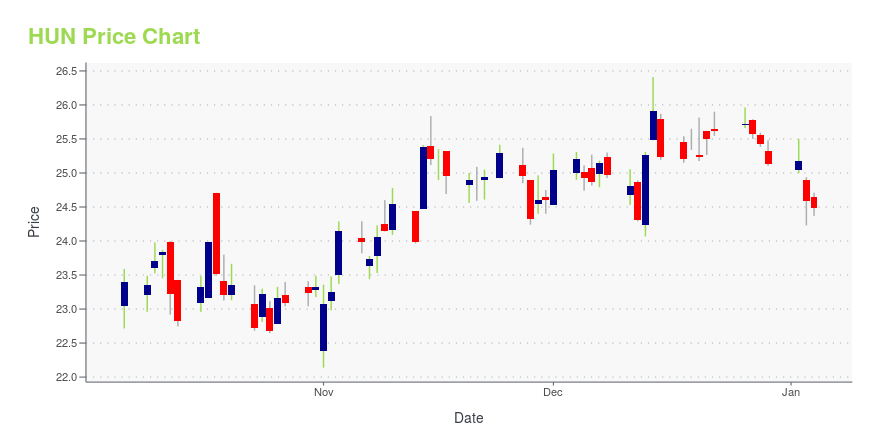
HUN Stock Price Chart Interactive Chart >
HUN Price/Volume Stats
Current price | $35.25 | 52-week high | $41.65 |
Prev. close | $35.30 | 52-week low | $24.09 |
Day low | $34.43 | Volume | 1,741,800 |
Day high | $35.88 | Avg. volume | 2,553,373 |
50-day MA | $35.96 | Dividend yield | 2.41% |
200-day MA | $33.37 | Market Cap | 7.40B |
Huntsman Corporation (HUN) Company Bio
Huntsman Corporation manufactures and sells differentiated organic and inorganic chemical products worldwide. The company operates in five segments: Polyurethanes, Performance Products, Advanced Materials, Textile Effects, and Pigments and Additives. The company was founded in 1970 and is based in Salt Lake City, Utah.
Latest HUN News From Around the Web
Below are the latest news stories about Huntsman CORP that investors may wish to consider to help them evaluate HUN as an investment opportunity.
Should Value Investors Buy Huntsman (HUN) Stock?Here at Zacks, our focus is on the proven Zacks Rank system, which emphasizes earnings estimates and estimate revisions to find great stocks. Nevertheless, we are always paying attention to the latest value, growth, and momentum trends to underscore strong picks. |
Here's Why Huntsman (HUN) is a Great Momentum Stock to BuyDoes Huntsman (HUN) have what it takes to be a top stock pick for momentum investors? Let's find out. |
Materials Sector Weekly Round-up: Huntsman tops list; Albemarle drops as oil sector faces pressureThe S&P Materials sector closed this week marginally up at +0.19%, with the Materials Select Sector SPDR (XLB) taking a slip dip at -0.24%.Gold prices (XAUUSD:CUR) were the highlight |
Is Glencore PLC (GLNCY) Stock Outpacing Its Basic Materials Peers This Year?Here is how Glencore PLC (GLNCY) and Huntsman (HUN) have performed compared to their sector so far this year. |
Huntsman (NYSE:HUN) Is Increasing Its Dividend To US$0.21Huntsman Corporation ( NYSE:HUN ) will increase its dividend on the 31st of March to US$0.21. This takes the annual... |
HUN Price Returns
1-mo | 3.16% |
3-mo | N/A |
6-mo | 7.41% |
1-year | 26.15% |
3-year | 102.67% |
5-year | 59.37% |
YTD | 1.63% |
2021 | 42.30% |
2020 | 7.52% |
2019 | 28.97% |
2018 | -40.64% |
2017 | 77.93% |
HUN Dividends
Ex-Dividend Date | Type | Payout Amount | Change | ||||||
---|---|---|---|---|---|---|---|---|---|
Loading, please wait... |
Continue Researching HUN
Want to do more research on Huntsman CORP's stock and its price? Try the links below:Huntsman CORP (HUN) Stock Price | Nasdaq
Huntsman CORP (HUN) Stock Quote, History and News - Yahoo Finance
Huntsman CORP (HUN) Stock Price and Basic Information | MarketWatch
Loading social stream, please wait...