Houston American Energy Corporation (HUSA): Price and Financial Metrics

Houston American Energy Corporation (HUSA): $1.30

0.03 (-2.26%)

POWR Rating

Component Grades

Momentum

C

Stability

D

Sentiment

Quality

D

Add HUSA to Watchlist
Sign Up

Industry: Energy - Oil & Gas

Industry

C

Ranked

#80 of 83

in industry

HUSA Price/Volume Stats
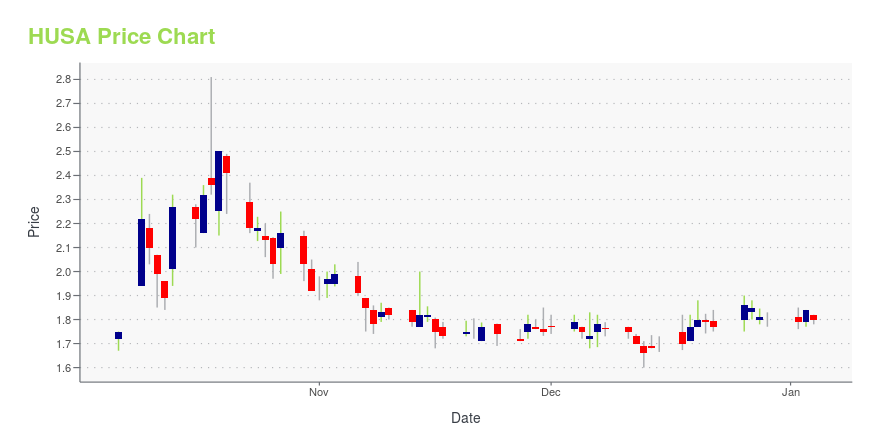
Current price $1.30 52-week high $3.12
Prev. close $1.33 52-week low $1.27
Day low $1.28 Volume 196,200
Day high $1.37 Avg. volume 86,162
50-day MA $1.47 Dividend yield N/A
200-day MA $1.89 Market Cap 14.18M

HUSA Stock Price Chart Interactive Chart >

HUSA POWR Grades

  • Growth is the dimension where HUSA ranks best; there it ranks ahead of 77.68% of US stocks.
  • The strongest trend for HUSA is in Growth, which has been heading up over the past 26 weeks.
  • HUSA ranks lowest in Value; there it ranks in the 0th percentile.

HUSA Stock Summary

  • Price to trailing twelve month operating cash flow for HUSA is currently 108.24, higher than 97.43% of US stocks with positive operating cash flow.
  • With a price/sales ratio of 23.01, HOUSTON AMERICAN ENERGY CORP has a higher such ratio than 94.77% of stocks in our set.
  • As for revenue growth, note that HUSA's revenue has grown -49.33% over the past 12 months; that beats the revenue growth of merely 4.72% of US companies in our set.
  • Stocks with similar financial metrics, market capitalization, and price volatility to HOUSTON AMERICAN ENERGY CORP are MMI, CVGW, TBI, JRSH, and AGTI.
  • HUSA's SEC filings can be seen here. And to visit HOUSTON AMERICAN ENERGY CORP's official web site, go to www.houstonamerican.com.

HUSA Valuation Summary

  • HUSA's EV/EBIT ratio is -93.3; this is 1224.1% lower than that of the median Energy stock.
  • Over the past 243 months, HUSA's price/sales ratio has gone down 52.4.

Below are key valuation metrics over time for HUSA.

Stock Date P/S P/B P/E EV/EBIT
HUSA 2023-12-28 22.6 1.5 -119.4 -93.3
HUSA 2023-12-27 23.2 1.5 -122.4 -96.4
HUSA 2023-12-26 23.3 1.5 -123.0 -97.0
HUSA 2023-12-22 22.1 1.5 -117.0 -90.9
HUSA 2023-12-21 22.4 1.5 -118.2 -92.1
HUSA 2023-12-20 22.5 1.5 -118.8 -92.7

HUSA Growth Metrics

    Its year over year net cashflow from operations growth rate is now at 51.58%.
  • The 5 year price growth rate now stands at -63.24%.
  • Its 3 year net cashflow from operations growth rate is now at -253.22%.
Over the past 67 months, HUSA's revenue has gone up $1,546,118.

The table below shows HUSA's growth in key financial areas (numbers in millions of US dollars).

Date Revenue Operating Cash Flow Net Income to Common Stock
2022-09-30 1.721401 -0.234775 -0.90931
2022-06-30 1.58452 -0.182293 -0.868905
2022-03-31 1.42553 -0.412307 -0.918614
2021-12-31 1.330198 -0.680691 -1.058731
2021-09-30 1.123718 -0.677543 -3.350813
2021-06-30 0.959768 -0.825107 -3.329303

HUSA's Quality Factors

The “Quality” component of the POWR Ratings focuses on 31 different factors of a companies fundamentals and operational strength. Here are some key insights as we drill into the specifics of these quality attributes.
  • HUSA has a Quality Grade of D, ranking ahead of 16.63% of graded US stocks.
  • HUSA's asset turnover comes in at 0.1 -- ranking 128th of 137 Petroleum and Natural Gas stocks.
  • TUSK, VTNR, and VNOM are the stocks whose asset turnover ratios are most correlated with HUSA.

The table below shows HUSA's key quality metrics over time.

Period Asset Turnover Gross Margin ROIC
2021-06-30 0.100 0.497 -0.500
2021-03-31 0.080 0.334 -0.531
2020-12-31 0.062 0.269 -0.590
2020-09-30 0.070 0.136 -0.385
2020-06-30 0.088 0.180 -0.386
2020-03-31 0.110 0.193 -0.400

Houston American Energy Corporation (HUSA) Company Bio


Houston American Energy Corp., an independent energy company, acquires, explores for, develops, and produces natural gas, crude oil, and condensate. Its oil and gas properties are located primarily in the Texas Permian Basin, the onshore Texas and Louisiana Gulf Coast region, and in the South American country of Colombia. As of December 31, 2019, the company owned interests in 4 gross wells. Houston American Energy Corp. was incorporated in 2001 and is based in Houston, Texas.


HUSA Latest News Stream


Event/Time News Detail
Loading, please wait...

HUSA Latest Social Stream


Loading social stream, please wait...

View Full HUSA Social Stream

Latest HUSA News From Around the Web

Below are the latest news stories about HOUSTON AMERICAN ENERGY CORP that investors may wish to consider to help them evaluate HUSA as an investment opportunity.

Houston American Energy Increases Interest in Colombian CPO-11 Project

Houston, TX, Dec. 09, 2022 (GLOBE NEWSWIRE) -- Houston American Energy Corp. (NYSE American: HUSA) today announced the acquisition of an additional interest in Hupecol Meta, LLC. Hupecol Meta owns the 639,405 gross acre CPO-11 block in the Llanos Basin in Colombia, comprised of the 69,128 acre Venus Exploration area, operated by Hupecol, and 570,277 acres which was 50% farmed out to Parex Resources by Hupecol. In total, the CPO-11 block covers almost 1000 square miles with multiple identified le

Yahoo | December 9, 2022

Read More 'HUSA' Stories Here

HUSA Price Returns

1-mo -11.56%
3-mo -27.78%
6-mo -34.34%
1-year -47.37%
3-year -40.09%
5-year -52.94%
YTD -27.37%
2023 -47.97%
2022 140.56%
2021 -18.29%
2020 -4.11%
2019 -23.16%

Continue Researching HUSA

Want to see what other sources are saying about Houston American Energy Corp's financials and stock price? Try the links below:

Houston American Energy Corp (HUSA) Stock Price | Nasdaq
Houston American Energy Corp (HUSA) Stock Quote, History and News - Yahoo Finance
Houston American Energy Corp (HUSA) Stock Price and Basic Information | MarketWatch

Get Free Updates

Join thousands of investors who get the latest news, insights and top rated picks from StockNews.com!