
Hydrofarm Holdings Group Inc. (HYFM): Price and Financial Metrics
HYFM Price/Volume Stats
| Current price | $0.66 | 52-week high | $1.64 |
| Prev. close | $0.65 | 52-week low | $0.64 |
| Day low | $0.65 | Volume | 52,403 |
| Day high | $0.68 | Avg. volume | 171,348 |
| 50-day MA | $0.74 | Dividend yield | N/A |
| 200-day MA | $0.89 | Market Cap | 30.35M |
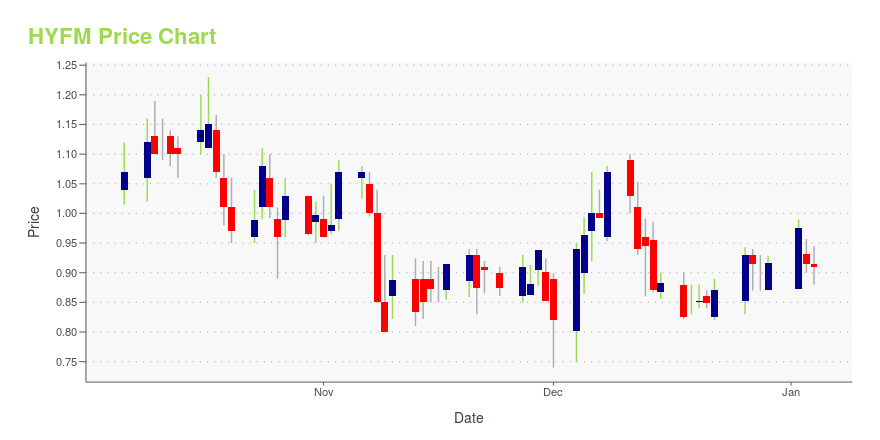
HYFM Stock Price Chart Interactive Chart >
Hydrofarm Holdings Group Inc. (HYFM) Company Bio
Hydrofarm Holdings Group, Inc. manufactures and distributes controlled environment agriculture equipment and supplies in the United States and Canada. The company offers lighting equipment, such as lighting systems/kits, grow light reflectors, grow light ballasts, LED lighting, fluorescent lighting, high-intensity discharge light systems, grow light reflectors, and lighting accessories; and equipment, including hydro components, meters and solutions, pumps and irrigation systems, water filtration systems, pots and containers, and tents and tarps. It also provides atmospheric control equipment comprising controllers, monitors and timers, ventilation/air conditioning equipment, air purification equipment, and CO2 equipment; premium soils; soil alternatives, such as rock wool, coconut coir, or clay pebbles; nutrients comprising fertilizers and additives; food storage products; and consumable supplies, including grow light bulbs, pruners, irrigation components, safety supplies, netting, containers, and trays. The company offers its products under the PHOTOBIO, Phantom, Quantum, Digilux, Jump Start, Active Aqua, Active Air, Autopilot, Xtrasun, Active Eye, Agrobrite, GROW!T, Phat, and oxyClone brands. Hydrofarm Holdings Group, Inc. was founded in 1977 and is headquartered in Petaluma, California.
Latest HYFM News From Around the Web
Below are the latest news stories about HYDROFARM HOLDINGS GROUP INC that investors may wish to consider to help them evaluate HYFM as an investment opportunity.
13 Best Hemp Stocks To Buy NowIn this article, we discuss the 13 best hemp stocks to buy now. If you want to skip our detailed analysis of these stocks, go directly to 5 Best Hemp Stocks To Buy Now. There is little doubt that emerging trends in the cannabis industry indicate that the hemp market is poised to benefit from […] |
12 Best CBD Stocks To Buy NowIn this article, we discuss the best CBD stocks to buy now. If you want to skip our detailed analysis of these stocks, go directly to 5 Best CBD Stocks To Buy Now. Cannabidiol, also known as CBD, is a chemical compound commonly found in marijuana. CBD can be derived from hemp or non-hemp plants. […] |
3 Top-Rated Cannabis Stocks That Analysts Are Loving NowSince the legalization of cannabis is grabbing the market by storm, it's best to jump in now with these winning stocks. |
11 Best Cannabis Stocks To Buy NowIn this article, we discuss 11 best cannabis stocks to buy now. If you want to see more stocks in this selection, check out 5 Best Cannabis Stocks To Buy Now. Cannabis, a flowering plant genus, boasts a rich history of utilization, primarily for its acknowledged therapeutic and medical benefits. Presently, over 52 million Americans […] |
Hydrofarm Holdings Group, Inc. (NASDAQ:HYFM) Q3 2023 Earnings Call TranscriptHydrofarm Holdings Group, Inc. (NASDAQ:HYFM) Q3 2023 Earnings Call Transcript November 9, 2023 Hydrofarm Holdings Group, Inc. reports earnings inline with expectations. Reported EPS is $-0.16 EPS, expectations were $-0.16. Operator: Good day, ladies and gentlemen, and thank you for standing by. Welcome to the Hydrofarm Holdings Group Third Quarter 2023 Earnings Conference Call. At […] |
HYFM Price Returns
| 1-mo | -7.30% |
| 3-mo | -19.62% |
| 6-mo | -34.33% |
| 1-year | -38.32% |
| 3-year | -98.65% |
| 5-year | N/A |
| YTD | -28.07% |
| 2023 | -40.81% |
| 2022 | -94.52% |
| 2021 | -46.20% |
| 2020 | N/A |
| 2019 | N/A |
Loading social stream, please wait...