MarineMax, Inc. (FL) (HZO): Price and Financial Metrics
GET POWR RATINGS... FREE!
HZO POWR Grades
- Value is the dimension where HZO ranks best; there it ranks ahead of 91.92% of US stocks.
- HZO's strongest trending metric is Stability; it's been moving down over the last 177 days.
- HZO ranks lowest in Sentiment; there it ranks in the 3rd percentile.
HZO Stock Summary
- With a price/earnings ratio of 3.87, MARINEMAX INC P/E ratio is greater than that of about merely 6.28% of stocks in our set with positive earnings.
- With a year-over-year growth in debt of 243.16%, MARINEMAX INC's debt growth rate surpasses 93.95% of about US stocks.
- Shareholder yield, a measure of how much is returned to shareholders via dividends and share repurchases, for HZO comes in at -86.15% -- higher than that of merely 5.96% of stocks in our set.
- If you're looking for stocks that are quantitatively similar to MARINEMAX INC, a group of peers worth examining would be SMP, ARC, KRT, ACU, and STRT.
- Visit HZO's SEC page to see the company's official filings. To visit the company's web site, go to www.marinemax.com.
HZO Valuation Summary
- HZO's price/sales ratio is 0.3; this is 84.21% lower than that of the median Consumer Cyclical stock.
- HZO's price/sales ratio has moved down 0 over the prior 243 months.
Below are key valuation metrics over time for HZO.
Stock | Date | P/S | P/B | P/E | EV/EBIT |
---|---|---|---|---|---|
HZO | 2023-01-26 | 0.3 | 0.8 | 3.3 | 2.7 |
HZO | 2023-01-25 | 0.3 | 1.0 | 3.8 | 3.0 |
HZO | 2023-01-24 | 0.3 | 0.9 | 3.7 | 3.0 |
HZO | 2023-01-23 | 0.3 | 0.9 | 3.7 | 3.0 |
HZO | 2023-01-20 | 0.3 | 0.9 | 3.7 | 3.0 |
HZO | 2023-01-19 | 0.3 | 0.9 | 3.7 | 2.9 |
HZO Growth Metrics
- Its 2 year revenue growth rate is now at 69.55%.
- The 2 year net cashflow from operations growth rate now stands at 914.97%.
- The 4 year net income to common stockholders growth rate now stands at 61.76%.

The table below shows HZO's growth in key financial areas (numbers in millions of US dollars).
Date | Revenue | Operating Cash Flow | Net Income to Common Stock |
---|---|---|---|
2022-09-30 | 2,308.098 | 76.595 | 197.989 |
2022-06-30 | 2,233.644 | 167.303 | 192.455 |
2022-03-31 | 2,211.435 | 316.337 | 181.894 |
2021-12-31 | 2,124.424 | 394.799 | 167.322 |
2021-09-30 | 2,063.257 | 373.881 | 154.979 |
2021-06-30 | 1,999.709 | 412.956 | 147.736 |
HZO's Quality Factors
The “Quality” component of the POWR Ratings focuses on 31 different factors of a companies fundamentals and operational strength. Here are some key insights as we drill into the specifics of these quality attributes.- HZO has a Quality Grade of A, ranking ahead of 96.27% of graded US stocks.
- HZO's asset turnover comes in at 2.209 -- ranking 36th of 165 Retail stocks.
- SHW, EZPW, and YGYI are the stocks whose asset turnover ratios are most correlated with HZO.
The table below shows HZO's key quality metrics over time.
Period | Asset Turnover | Gross Margin | ROIC |
---|---|---|---|
2021-06-30 | 2.209 | 0.301 | 0.351 |
2021-03-31 | 2.154 | 0.284 | 0.295 |
2020-12-31 | 1.931 | 0.273 | 0.208 |
2020-09-30 | 1.876 | 0.264 | 0.181 |
2020-06-30 | 1.758 | 0.261 | 0.140 |
2020-03-31 | 1.606 | 0.264 | 0.106 |
HZO Price Target
For more insight on analysts targets of HZO, see our HZO price target page. And for a list of of all stocks sorted by upside potential based on analyst target price, see our Top Price Target page.
Average Price Target | $59.67 | Average Broker Recommendation | 1.69 (Moderate Buy) |
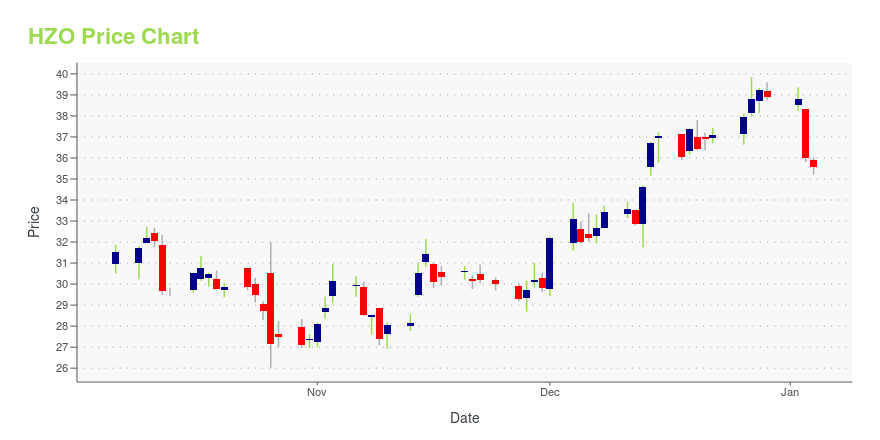
HZO Stock Price Chart Interactive Chart >
HZO Price/Volume Stats
Current price | $30.80 | 52-week high | $50.32 |
Prev. close | $32.18 | 52-week low | $27.40 |
Day low | $30.80 | Volume | 648,100 |
Day high | $32.27 | Avg. volume | 502,817 |
50-day MA | $32.09 | Dividend yield | N/A |
200-day MA | $35.68 | Market Cap | 673.10M |
MarineMax, Inc. (FL) (HZO) Company Bio
MarineMax Inc. operates as a recreational boat and yacht retailer in the United States. The company was founded in 1998 and is based in Clearwater, Florida.
Latest HZO News From Around the Web
Below are the latest news stories about MARINEMAX INC that investors may wish to consider to help them evaluate HZO as an investment opportunity.
MarineMax, Inc. (NYSE:HZO) Q1 2023 Earnings Call TranscriptMarineMax, Inc. (NYSE:HZO) Q1 2023 Earnings Call Transcript January 27, 2023 Operator: Good morning, and welcome to the MarineMax, Inc. Fiscal 2023 First Quarter Conference Call. Today’s call is being recorded. All participants have been placed in a listen-only mode. We will have a question-and-answer session at the end of today’s prepared remarks. At this […] |
MarineMax Poised To Gain Share In Marine Market, Analyst SaysRaymond James analyst Joseph Altobello reiterated an Outperform rating on the shares of MarineMax Inc (NYSE: HZO ), reflecting the belief that the company should continue to gain market share in a generally healthy (albeit slowing) U.S. marine industry. Meanwhile, the analyst lowered the price target from $55 to $40 by applying a more conservative P/E approach reflecting the heightened macroeconomic and industry uncertainty. MarineMax reported Q1 results Thursday morning that were below expectations, as revenue contributions from recent acquisitions offset a modest decline in same-store sales but were not enough to overcome higher SG&A and … Full story available on Benzinga.com |
MarineMax (HZO) Investor Presentation - Slideshow (NYSE:HZO)The following slide deck was published by MarineMax, Inc. |
MarineMax, Inc. (HZO) Q1 2023 Earnings Call TranscriptMarineMax, Inc. (NYSE:NYSE:HZO) Q1 2023 Earnings Conference Call January 26, 2023 10:00 AM ETCompany ParticipantsScott Solomon - Investor Relations-Sharon MerrillMike McLamb - Chief… |
MarineMax Reports Fiscal 2023 First Quarter ResultsCLEARWATER, Fla.--(BUSINESS WIRE)--MarineMax, Inc. (NYSE: HZO), the world’s largest recreational boat, yacht and superyacht company, today announced results for its first quarter ended December 31, 2022. Revenue increased 7% to a record $507.9 million for the quarter ended December 31, 2022, from $472.7 million in the comparable period last year. The growth was primarily driven by contributions from strategic acquisitions, including IGY Marinas which closed in October 2022. As a result of the c |
HZO Price Returns
1-mo | -3.84% |
3-mo | -6.27% |
6-mo | -19.65% |
1-year | -32.50% |
3-year | 53.85% |
5-year | 47.37% |
YTD | -1.35% |
2022 | -47.12% |
2021 | 68.54% |
2020 | 109.89% |
2019 | -8.85% |
2018 | -3.12% |
Continue Researching HZO
Here are a few links from around the web to help you further your research on Marinemax Inc's stock as an investment opportunity:Marinemax Inc (HZO) Stock Price | Nasdaq
Marinemax Inc (HZO) Stock Quote, History and News - Yahoo Finance
Marinemax Inc (HZO) Stock Price and Basic Information | MarketWatch
Loading social stream, please wait...