
Interactive Brokers Group Inc. (IBKR): Price and Financial Metrics
IBKR Price/Volume Stats
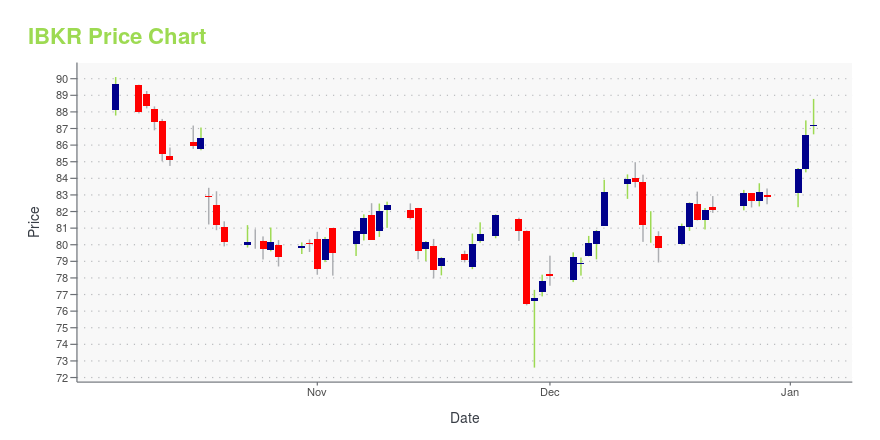
| Current price | $118.80 | 52-week high | $129.19 |
| Prev. close | $118.57 | 52-week low | $72.60 |
| Day low | $117.52 | Volume | 839,500 |
| Day high | $119.24 | Avg. volume | 1,048,338 |
| 50-day MA | $123.34 | Dividend yield | 0.82% |
| 200-day MA | $102.79 | Market Cap | 50.02B |
IBKR Stock Price Chart Interactive Chart >
Interactive Brokers Group Inc. (IBKR) Company Bio
Interactive Brokers LLC (IB) is an American multinational brokerage firm. It operates the largest electronic trading platform in the U.S. by number of daily average revenue trades. The company brokers stocks, options, futures, EFPs, futures options, forex, bonds, and funds. (Source:Wikipedia)
Latest IBKR News From Around the Web
Below are the latest news stories about INTERACTIVE BROKERS GROUP INC that investors may wish to consider to help them evaluate IBKR as an investment opportunity.
Interactive Brokers Group to Host Fourth Quarter Earnings Conference CallGREENWICH, Conn., December 26, 2023--Interactive Brokers Group, Inc. (Nasdaq: IBKR) plans to announce its fourth quarter financial results on Tuesday, January 16, 2024, in a release that will be issued at approximately 4:00 pm (ET). The press release will also be available on the company's website, www.interactivebrokers.com/ir. |
Interactive Brokers’ Steve Sanders: How We’re Taking On the Big Guns in RIA CustodyThe executive explains why RIA custodians are really technology businesses, how the company keeps costs down, and why some advisors are migrating to Interactive Brokers. |
The Zacks Analyst Blog Highlights NVIDIA, Coinbase Global, Block, Interactive Brokers Group and PayPal HoldingsNVIDIA, Coinbase Global, Block, Interactive Brokers Group and PayPal Holdings are included in this Analyst Blog. |
Here’s Why Interactive Brokers Group (IBKR) Stock Gained 4% in Q3TimesSquare Capital Management, an equity investment management company, released its “U.S. Mid Cap Growth Strategy” third-quarter investor letter. A copy of the same can be downloaded here. In the third quarter, the strategy outperformed the Russell Midcap Growth Index and returned -4.11% (net) while the index return was -5.22%. The third quarter saw a decline in […] |
The Next Bitcoin Halving Is Coming! 3 Crypto Stocks to Reap the Most Rewards.Riot Blockchain, Coinbase, and Interactive Brokers are the crypto stocks set for a major rally ahead of the Bitcoin halving in 2024. |
IBKR Price Returns
| 1-mo | -3.41% |
| 3-mo | 2.48% |
| 6-mo | 29.87% |
| 1-year | 37.51% |
| 3-year | 99.82% |
| 5-year | 141.94% |
| YTD | 43.72% |
| 2023 | 15.14% |
| 2022 | -8.35% |
| 2021 | 31.12% |
| 2020 | 31.71% |
| 2019 | -14.01% |
IBKR Dividends
| Ex-Dividend Date | Type | Payout Amount | Change | ||||||
|---|---|---|---|---|---|---|---|---|---|
| Loading, please wait... | |||||||||
Continue Researching IBKR
Want to see what other sources are saying about Interactive Brokers Group Inc's financials and stock price? Try the links below:Interactive Brokers Group Inc (IBKR) Stock Price | Nasdaq
Interactive Brokers Group Inc (IBKR) Stock Quote, History and News - Yahoo Finance
Interactive Brokers Group Inc (IBKR) Stock Price and Basic Information | MarketWatch
Loading social stream, please wait...