ICON PLC (ICLR): Price and Financial Metrics
GET POWR RATINGS... FREE!
ICLR POWR Grades
- Sentiment is the dimension where ICLR ranks best; there it ranks ahead of 92.32% of US stocks.
- ICLR's strongest trending metric is Stability; it's been moving up over the last 178 days.
- ICLR's current lowest rank is in the Quality metric (where it is better than 20.56% of US stocks).
ICLR Stock Summary
- ICLR has a market capitalization of $16,978,068,551 -- more than approximately 89.03% of US stocks.
- The price/operating cash flow metric for ICON PLC is higher than 84.82% of stocks in our set with a positive cash flow.
- In terms of twelve month growth in earnings before interest and taxes, ICON PLC is reporting a growth rate of 110.76%; that's higher than 87.51% of US stocks.
- If you're looking for stocks that are quantitatively similar to ICON PLC, a group of peers worth examining would be FWONA, MOS, LBRDA, H, and NXST.
- ICLR's SEC filings can be seen here. And to visit ICON PLC's official web site, go to www.iconplc.com.
ICLR Valuation Summary
- ICLR's price/sales ratio is 2.2; this is 15.79% higher than that of the median Healthcare stock.
- Over the past 243 months, ICLR's EV/EBIT ratio has gone up 13.5.
Below are key valuation metrics over time for ICLR.
Stock | Date | P/S | P/B | P/E | EV/EBIT |
---|---|---|---|---|---|
ICLR | 2023-03-17 | 2.2 | 2.0 | 33.6 | 27.0 |
ICLR | 2023-03-16 | 2.3 | 2.1 | 34.5 | 27.6 |
ICLR | 2023-03-15 | 2.2 | 2.0 | 33.9 | 27.2 |
ICLR | 2023-03-14 | 2.3 | 2.1 | 34.8 | 27.8 |
ICLR | 2023-03-13 | 2.2 | 2.0 | 34.3 | 27.4 |
ICLR | 2023-03-10 | 2.3 | 2.1 | 34.6 | 27.7 |
ICLR Growth Metrics
- Its 5 year net income to common stockholders growth rate is now at 39.45%.
- Its 2 year net income to common stockholders growth rate is now at -55.47%.
- Its 4 year cash and equivalents growth rate is now at 103.28%.

The table below shows ICLR's growth in key financial areas (numbers in millions of US dollars).
Date | Revenue | Operating Cash Flow | Net Income to Common Stock |
---|---|---|---|
2022-12-31 | 7,741.386 | 563.315 | 505.304 |
2022-09-30 | 7,664.505 | 912.559 | 464.326 |
2022-09-30 | 7,664.505 | 912.559 | 464.326 |
2022-06-30 | 7,588.43 | 997.754 | 209.902 |
2022-06-30 | 7,588.43 | 997.754 | 209.902 |
2022-03-31 | 6,524.392 | 944.138 | 168.033 |
ICLR's Quality Factors
The “Quality” component of the POWR Ratings focuses on 31 different factors of a companies fundamentals and operational strength. Here are some key insights as we drill into the specifics of these quality attributes.- ICLR has a Quality Grade of B, ranking ahead of 84.72% of graded US stocks.
- ICLR's asset turnover comes in at 0.882 -- ranking 150th of 561 Business Services stocks.
- 500 - Internal server error
The table below shows ICLR's key quality metrics over time.
Period | Asset Turnover | Gross Margin | ROIC |
---|---|---|---|
2020-12-31 | 0.882 | 0.292 | 0.489 |
2019-12-31 | 1.067 | 0.296 | 0.542 |
2018-12-31 | 1.153 | 0.300 | 0.447 |
2017-12-31 | 0.885 | 0.416 | 0.420 |
2016-12-31 | 0.940 | 0.423 | 0.403 |
2015-12-31 | 0.970 | 0.423 | 0.516 |
ICLR Price Target
For more insight on analysts targets of ICLR, see our ICLR price target page. And for a list of of all stocks sorted by upside potential based on analyst target price, see our Top Price Target page.
Average Price Target | $205.14 | Average Broker Recommendation | 1.72 (Moderate Buy) |
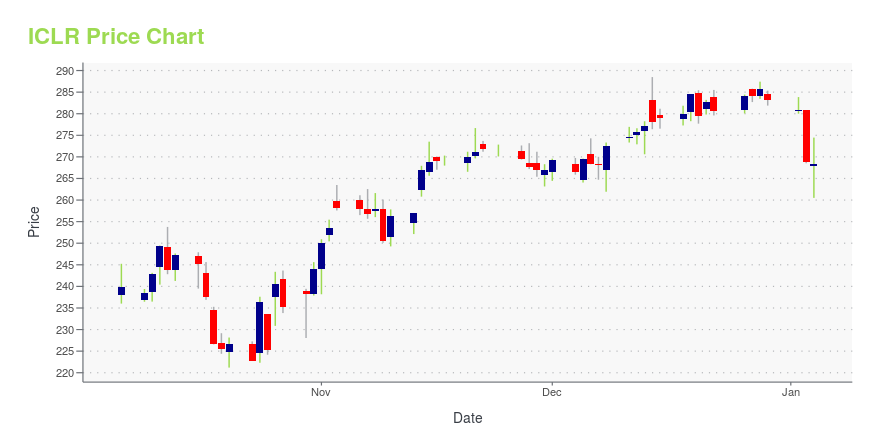
ICLR Stock Price Chart Interactive Chart >
ICLR Price/Volume Stats
Current price | $208.58 | 52-week high | $263.62 |
Prev. close | $207.75 | 52-week low | $171.43 |
Day low | $203.24 | Volume | 674,900 |
Day high | $209.62 | Avg. volume | 525,096 |
50-day MA | $226.39 | Dividend yield | N/A |
200-day MA | $213.27 | Market Cap | 17.05B |
ICON PLC (ICLR) Company Bio
ICON Public Limited Company provides outsourced development services to the pharmaceutical, biotechnology, and medical device industries in Ireland, rest of Europe, the United States, and internationally. The company was founded in 1990 and is based in Dublin, Ireland.
Latest ICLR News From Around the Web
Below are the latest news stories about ICON PLC that investors may wish to consider to help them evaluate ICLR as an investment opportunity.
Does The Market Have A Low Tolerance For ICON Public Limited Company's (NASDAQ:ICLR) Mixed Fundamentals?It is hard to get excited after looking at ICON's (NASDAQ:ICLR) recent performance, when its stock has declined 9.2... |
LEO Pharma and ICON Enter a Strategic Partnership to Propel Clinical Trial Execution Within Medical DermatologyBALLERUP, Denmark & DUBLIN, March 10, 2023--LEO Pharma, a global leader in medical dermatology, and ICON plc (NASDAQ: ICLR) today announced a strategic partnership that will enable LEO Pharma to scale clinical trial execution that is patient-centric and cost effective, and which will support the company’s overall ambition of building one of the most effective and efficient clinical portfolio execution organisations in the industry. |
ICON plc to Present at Upcoming Investor ConferencesDUBLIN, February 27, 2023--ICON plc to Present at Upcoming Investor Conferences |
ICON Full Year 2022 Earnings: EPS Misses ExpectationsICON ( NASDAQ:ICLR ) Full Year 2022 Results Key Financial Results Revenue: US$7.74b (up 41% from FY 2021). Net income... |
Icon PLC (ICLR) Surpasses Q4 Earnings and Revenue EstimatesIcon PLC (ICLR) delivered earnings and revenue surprises of 2.29% and 0.44%, respectively, for the quarter ended December 2022. Do the numbers hold clues to what lies ahead for the stock? |
ICLR Price Returns
1-mo | -8.34% |
3-mo | 5.64% |
6-mo | 9.19% |
1-year | -12.81% |
3-year | 72.04% |
5-year | 77.03% |
YTD | 7.38% |
2022 | -37.28% |
2021 | 58.84% |
2020 | 13.21% |
2019 | 33.29% |
2018 | 15.21% |
Loading social stream, please wait...