ICU Medical, Inc. (ICUI): Price and Financial Metrics

ICU Medical, Inc. (ICUI): $99.17

1.09 (+1.11%)

POWR Rating

Component Grades

Momentum

F

Stability

C

Sentiment

Quality

C

ICUI Price/Volume Stats

Current price $99.17 52-week high $212.43
Prev. close $98.08 52-week low $78.28
Day low $97.05 Volume 263,300
Day high $100.36 Avg. volume 271,687
50-day MA $99.38 Dividend yield N/A
200-day MA $123.50 Market Cap 2.39B

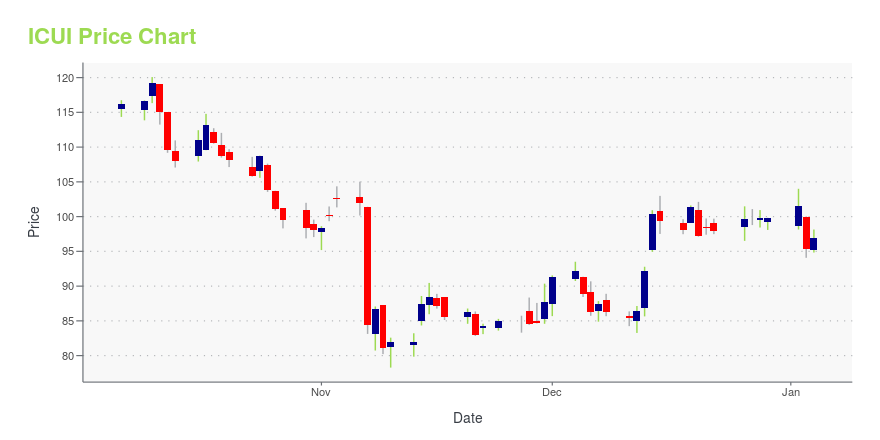
ICUI Stock Price Chart Interactive Chart >

ICUI POWR Grades

  • ICUI scores best on the Value dimension, with a Value rank ahead of 93.79% of US stocks.
  • The strongest trend for ICUI is in Growth, which has been heading down over the past 26 weeks.
  • ICUI ranks lowest in Momentum; there it ranks in the 7th percentile.

ICUI Stock Summary

  • Price to trailing twelve month operating cash flow for ICUI is currently 31.45, higher than 87.03% of US stocks with positive operating cash flow.
  • In terms of twelve month growth in earnings before interest and taxes, ICU MEDICAL INC is reporting a growth rate of -226.73%; that's higher than merely 5.59% of US stocks.
  • The volatility of ICU MEDICAL INC's share price is greater than that of 82.97% US stocks with at least 200 days of trading history.
  • Stocks that are quantitatively similar to ICUI, based on their financial statements, market capitalization, and price volatility, are IAC, LUNA, VERX, TTMI, and HIMS.
  • Visit ICUI's SEC page to see the company's official filings. To visit the company's web site, go to www.icumed.com.

ICUI Valuation Summary

  • In comparison to the median Healthcare stock, ICUI's price/sales ratio is 73.81% lower, now standing at 1.1.
  • Over the past 243 months, ICUI's price/sales ratio has gone down 3.4.

Below are key valuation metrics over time for ICUI.

Stock Date P/S P/B P/E EV/EBIT
ICUI 2023-12-29 1.1 1.1 -85.9 166.8
ICUI 2023-12-28 1.1 1.1 -85.9 166.8
ICUI 2023-12-27 1.1 1.1 -85.8 166.7
ICUI 2023-12-26 1.1 1.1 -85.7 166.7
ICUI 2023-12-22 1.1 1.1 -84.3 164.9
ICUI 2023-12-21 1.1 1.1 -84.7 165.4

ICUI Growth Metrics

    The 5 year net cashflow from operations growth rate now stands at 11287.81%.
  • Its 2 year revenue growth rate is now at 21.96%.
  • The 2 year net income to common stockholders growth rate now stands at -52.42%.
ICUI's revenue has moved up $1,505,252,000 over the prior 67 months.

The table below shows ICUI's growth in key financial areas (numbers in millions of US dollars).

Date Revenue Operating Cash Flow Net Income to Common Stock
2022-09-30 2,042.508 22.203 -38.825
2022-06-30 1,780.711 98.729 5.464
2022-03-31 1,541.384 214.876 41.336
2021-12-31 1,316.308 267.538 103.135
2021-09-30 1,296.234 263.443 109.352
2021-06-30 1,278.741 260.094 103.257

ICUI's Quality Factors

The “Quality” component of the POWR Ratings focuses on 31 different factors of a companies fundamentals and operational strength. Here are some key insights as we drill into the specifics of these quality attributes.
  • ICUI has a Quality Grade of B, ranking ahead of 76.17% of graded US stocks.
  • ICUI's asset turnover comes in at 0.724 -- ranking 47th of 186 Medical Equipment stocks.
  • ABMD, ECIA, and STXS are the stocks whose asset turnover ratios are most correlated with ICUI.

The table below shows ICUI's key quality metrics over time.

Period Asset Turnover Gross Margin ROIC
2021-06-30 0.724 0.368 0.127
2021-03-31 0.708 0.359 0.111
2020-12-31 0.709 0.363 0.104
2020-09-30 0.713 0.360 0.094
2020-06-30 0.716 0.367 0.102
2020-03-31 0.747 0.362 0.110

ICUI Price Target

For more insight on analysts targets of ICUI, see our ICUI price target page. And for a list of of all stocks sorted by upside potential based on analyst target price, see our Top Price Target page.

Average Price Target $296.00 Average Broker Recommendation 1.5 (Moderate Buy)

ICU Medical, Inc. (ICUI) Company Bio


ICU Medical develops, manufactures, and sells medical devices used in infusion therapy, oncology, and critical care applications worldwide. The company was founded in 1984 and is based in San Clemente, California.


ICUI Latest News Stream


Event/Time News Detail
Loading, please wait...

ICUI Latest Social Stream


Loading social stream, please wait...

View Full ICUI Social Stream

Latest ICUI News From Around the Web

Below are the latest news stories about ICU MEDICAL INC that investors may wish to consider to help them evaluate ICUI as an investment opportunity.

Is ICU Medical, Inc. (NASDAQ:ICUI) Trading At A 50% Discount?

Key Insights The projected fair value for ICU Medical is US$168 based on 2 Stage Free Cash Flow to Equity ICU Medical's...

Yahoo | November 29, 2023

Carlyle Group and WP Carey Set to Join S&P MidCap 400; Others to Join S&P SmallCap 600

S&P Dow Jones Indices will make the following changes to the S&P MidCap 400 and S&P SmallCap 600 effective prior to the open of trading on Thursday, November 30:

Yahoo | November 27, 2023

ICU Medical, Inc. (NASDAQ:ICUI) Q3 2023 Earnings Call Transcript

ICU Medical, Inc. (NASDAQ:ICUI) Q3 2023 Earnings Call Transcript November 6, 2023 ICU Medical, Inc. beats earnings expectations. Reported EPS is $1.57, expectations were $1.29. Operator: Good afternoon. And welcome to the ICU Medical Inc. Third Quarter 2023 Earnings Conference Call [Operator Instructions]. Please note, this event is being recorded. I would like now to […]

Yahoo | November 7, 2023

ICU Medical Inc (ICUI) Reports Q3 2023 Earnings: Revenue Down 7.5%, Net Income Turns Positive

Despite a decrease in revenue, ICU Medical Inc (ICUI) sees a positive net income in Q3 2023, compared to a net loss in the same period last year.

Yahoo | November 6, 2023

ICU Medical Announces Third Quarter 2023 Results

SAN CLEMENTE, Calif., Nov. 06, 2023 (GLOBE NEWSWIRE) -- ICU Medical, Inc. (Nasdaq:ICUI), a leader in the development, manufacture and sale of innovative medical products, today announced financial results for the quarter ended September 30, 2023. Third Quarter 2023 Results Third quarter 2023 revenue was $553.3 million, compared to $597.9 million in the same period last year. GAAP gross profit for the third quarter of 2023 was $183.9 million, as compared to $186.4 million in the same period last

Yahoo | November 6, 2023

Read More 'ICUI' Stories Here

ICUI Price Returns

1-mo -6.92%
3-mo 2.02%
6-mo -15.17%
1-year -38.60%
3-year -52.19%
5-year -58.03%
YTD -0.57%
2023 -36.66%
2022 -33.65%
2021 10.65%
2020 14.63%
2019 -18.51%

Get Free Updates

Join thousands of investors who get the latest news, insights and top rated picks from StockNews.com!