Information Services Group, Inc. (III): Price and Financial Metrics

Information Services Group, Inc. (III): $4.41

0.02 (-0.45%)

POWR Rating

Component Grades

Momentum

C

Stability

B

Sentiment

Quality

C

Add III to Watchlist
Sign Up

Industry: Technology - Services

Industry

C

Ranked

#27 of 76

in industry

III Price/Volume Stats

Current price $4.41 52-week high $5.87
Prev. close $4.43 52-week low $3.97
Day low $4.35 Volume 99,083
Day high $4.59 Avg. volume 122,109
50-day MA $4.28 Dividend yield 4.13%
200-day MA $4.90 Market Cap 215.53M

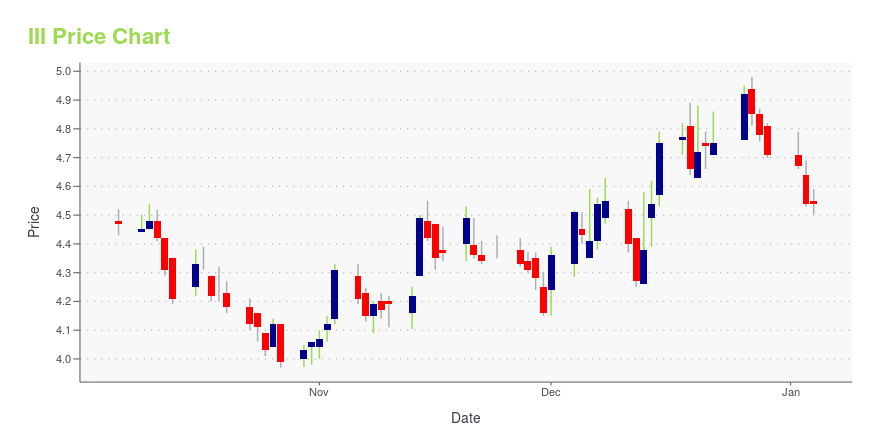
III Stock Price Chart Interactive Chart >

III POWR Grades

  • Stability is the dimension where III ranks best; there it ranks ahead of 88.79% of US stocks.
  • III's strongest trending metric is Growth; it's been moving down over the last 177 days.
  • III ranks lowest in Growth; there it ranks in the 20th percentile.

III Stock Summary

  • The capital turnover (annual revenue relative to shareholder's equity) for III is 2.83 -- better than 80.85% of US stocks.
  • The price/operating cash flow metric for INFORMATION SERVICES GROUP INC is higher than 81.26% of stocks in our set with a positive cash flow.
  • Of note is the ratio of INFORMATION SERVICES GROUP INC's sales and general administrative expense to its total operating expenses; 77% of US stocks have a lower such ratio.
  • If you're looking for stocks that are quantitatively similar to INFORMATION SERVICES GROUP INC, a group of peers worth examining would be G, CCS, KMT, DTC, and ASGN.
  • To check out INFORMATION SERVICES GROUP INC's SEC filings, go to the company's page on browse-edgar?action=getcompany&CIK=0001371489.

III Valuation Summary

  • III's price/earnings ratio is 15.8; this is 38.76% lower than that of the median Technology stock.
  • Over the past 204 months, III's price/earnings ratio has gone up 9283.7.

Below are key valuation metrics over time for III.

Stock Date P/S P/B P/E EV/EBIT
III 2023-11-28 0.7 2.0 15.8 10.8
III 2023-11-27 0.7 2.0 15.9 10.8
III 2023-11-24 0.7 2.0 16.1 10.9
III 2023-11-22 0.7 2.0 15.9 10.8
III 2023-11-21 0.7 2.0 16.0 10.9
III 2023-11-20 0.7 2.1 16.5 11.1

III Growth Metrics

    Its 4 year cash and equivalents growth rate is now at -47.94%.
  • Its year over year net income to common stockholders growth rate is now at 125.96%.
  • Its 3 year cash and equivalents growth rate is now at 219.51%.
Over the past 33 months, III's revenue has gone up $15,906,000.

The table below shows III's growth in key financial areas (numbers in millions of US dollars).

Date Revenue Operating Cash Flow Net Income to Common Stock
2022-09-30 281.669 7.073 19.021
2022-06-30 283.928 25.948 17.886
2022-03-31 283.824 34 17.035
2021-12-31 277.832 41.942 15.529
2021-09-30 274.652 46.128 13.399
2021-06-30 265.192 37.93 11.033

III's Quality Factors

The “Quality” component of the POWR Ratings focuses on 31 different factors of a companies fundamentals and operational strength. Here are some key insights as we drill into the specifics of these quality attributes.
  • III has a Quality Grade of B, ranking ahead of 90.89% of graded US stocks.
  • III's asset turnover comes in at 1.118 -- ranking 106th of 563 Business Services stocks.
  • TRIP, LTRPA, and G are the stocks whose asset turnover ratios are most correlated with III.

The table below shows III's key quality metrics over time.

Period Asset Turnover Gross Margin ROIC
2021-06-30 1.118 0.399 0.148
2021-03-31 1.086 0.405 0.123
2020-12-31 1.109 0.398 0.072
2020-09-30 1.131 0.403 0.080
2020-06-30 1.173 0.415 0.093
2020-03-31 1.219 0.420 0.086

III Price Target

For more insight on analysts targets of III, see our III price target page. And for a list of of all stocks sorted by upside potential based on analyst target price, see our Top Price Target page.

Average Price Target $9.33 Average Broker Recommendation 1.25 (Strong Buy)

Information Services Group, Inc. (III) Company Bio


Information Services Group, Inc., together with its subsidiaries, provides technology insights, market intelligence, and advisory services in the Americas, Europe, and the Asia Pacific. The company supports private and public sector organizations to transform and optimize their operational environments through research, benchmarking, consulting, and managed services with a focus on information technology, business process transformation, program management services, and enterprise resource planning. The company was founded in 2006 and is based in Stamford, Connecticut.


III Latest News Stream


Event/Time News Detail
Loading, please wait...

III Latest Social Stream


Loading social stream, please wait...

View Full III Social Stream

Latest III News From Around the Web

Below are the latest news stories about INFORMATION SERVICES GROUP INC that investors may wish to consider to help them evaluate III as an investment opportunity.

ISG to Publish Reports on Digital Engineering Services

STAMFORD, Conn., December 04, 2023--ISG has launched a research study examining digital engineering services enhancing the engineering process for a growing number of enterprises.

Yahoo | December 4, 2023

Tech With Benefits: 7 Stocks Offering Growth and Passive Income

While innovation typically coincides exclusively with a growth-centric business model, that’s not always the case as these tech stocks to buy for growth and passive income demonstrates.

Josh Enomoto on InvestorPlace | November 30, 2023

ISG to Publish Reports on Procurement Services, Platforms

STAMFORD, Conn., November 29, 2023--ISG has launched a research study evaluating providers of procurement services and software platforms to support supply chain modernization.

Yahoo | November 29, 2023

CORRECTING and REPLACING ISG Announces 2023 ISG Paragon Awards™ EMEA Winners

LONDON, November 28, 2023--ISG today announced the winners of the 2023 ISG Paragon Awards™ EMEA, which celebrate the ongoing transformation of sourcing industry partnerships.

Yahoo | November 28, 2023

ISG to Publish Reports on ServiceNow Partner Ecosystem

STAMFORD, Conn., November 28, 2023--ISG has launched a study evaluating ServiceNow ecosystem partners that are transforming siloed business processes for improved workflows.

Yahoo | November 28, 2023

Read More 'III' Stories Here

III Price Returns

1-mo 5.84%
3-mo -8.12%
6-mo -13.21%
1-year -12.57%
3-year 52.22%
5-year 14.72%
YTD -0.60%
2022 -38.12%
2021 135.39%
2020 29.64%
2019 -40.33%
2018 1.68%

III Dividends

Ex-Dividend Date Type Payout Amount Change
Loading, please wait...
View Full III Dividend History

Get Free Updates

Join thousands of investors who get the latest news, insights and top rated picks from StockNews.com!