
iMedia Brands, Inc. (IMBI): Price and Financial Metrics
IMBI Price/Volume Stats
| Current price | $0.11 | 52-week high | $1.81 |
| Prev. close | $0.14 | 52-week low | $0.11 |
| Day low | $0.11 | Volume | 27,575,400 |
| Day high | $0.12 | Avg. volume | 2,707,554 |
| 50-day MA | $0.20 | Dividend yield | N/A |
| 200-day MA | $0.50 | Market Cap | 3.18M |
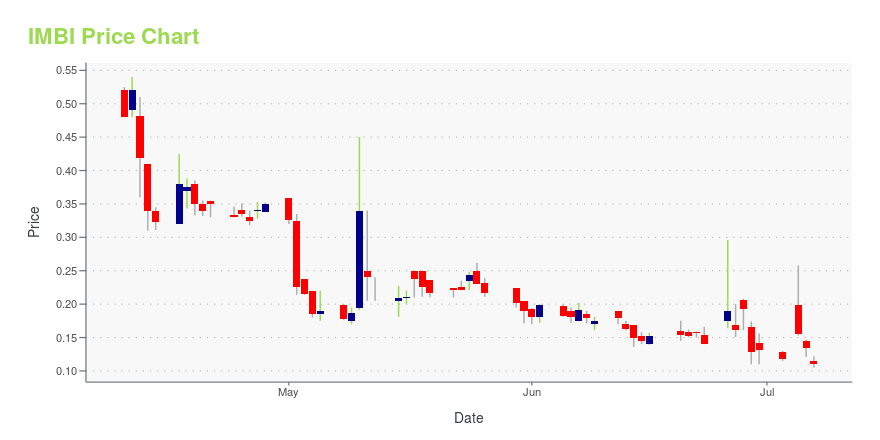
IMBI Stock Price Chart Interactive Chart >
iMedia Brands, Inc. (IMBI) Company Bio
iMedia Brands, Inc. operates as a multiplatform interactive digital commerce company in the United States. The company markets, sells, and distributes products to consumers through television, online, mobile, and social media in various merchandise categories, such as jewelry and watches, which include silver, gold, and gemstones to simulated diamonds; home and consumer electronics comprising home décor, bed and bath textiles, cookware, kitchen electrics, tabletop accessories, and home furnishings; beauty products, such as skincare, cosmetics, hair care, and bath and body products; and fashion and accessories, including apparel, outerwear, intimates, handbags, accessories, and footwear. It has access to approximately 87 million homes primarily on cable and satellite systems, as well as offers its products through online at evine.com. The company was formerly known as EVINE Live Inc. and changed its name to iMedia Brands, Inc. in July 2019. iMedia Brands, Inc. was founded in 1990 and is headquartered in Eden Prairie, Minnesota.
Latest IMBI News From Around the Web
Below are the latest news stories about IMEDIA BRANDS INC that investors may wish to consider to help them evaluate IMBI as an investment opportunity.
Why Is Alpine Summit Energy (ALPS) Stock Down 4% Today?Alpine Summit Energy (ALPS) stock is falling on Friday after the energy development company filed for Chapter 11 bankruptcy protection. |
Why Is iMedia Brands (IMBI) Stock Down 13% Today?Imedia Brands (IMBI) stock is taking a beating on Friday after it revealed it received a new delisting notice from the Nasdaq Exchange. |
Today’s Biggest Pre-Market Stock Movers: 10 Top Gainers and Losers on FridayWe're starting off the final day of the week with a breakdown of the biggest pre-market stock movers for Friday morning! |
iMedia Brands Enters into an Asset and Equity Purchase Agreement with RNN National Media GroupMINNEAPOLIS, July 07, 2023--Global media company iMedia Brands, Inc. (the "Company" or "iMedia") (NASDAQ: IMBI, IMBIL) today announced that it has entered into an asset and equity purchase agreement (the "AEPA") with an affiliate of RNN National Media Group ("RNN"), a privately owned portfolio of independent broadcast assets and production and distribution capabilities, to sell substantially all of the Company’s assets, including its ShopHQ Networks, 1-2-3.tv, iMDS, J.W. Hulme, and Christopher & |
iMedia Brands Receives Nasdaq Delisting Notice Following Chapter 11 FilingMINNEAPOLIS, July 06, 2023--Global media company iMedia Brands, Inc. (the "Company" or "iMedia") (NASDAQ: IMBI, IMBIL) today announced that on June 29, 2023, it was notified by the Listing Qualifications Department of The Nasdaq Stock Market ("Nasdaq") that they had determined to delist the Company’s common stock and its 8.5% Senior Notes due 2026 as a result of the Company’s commencement of voluntary proceedings under Chapter 11 of the United States Bankruptcy Code. Nasdaq informed the Company |
IMBI Price Returns
| 1-mo | N/A |
| 3-mo | N/A |
| 6-mo | N/A |
| 1-year | N/A |
| 3-year | -98.30% |
| 5-year | -97.38% |
| YTD | N/A |
| 2023 | 0.00% |
| 2022 | -89.33% |
| 2021 | 25.52% |
| 2020 | 19.80% |
| 2019 | -0.25% |
Loading social stream, please wait...