ImmunoGen, Inc. (IMGN): Price and Financial Metrics
IMGN Price/Volume Stats
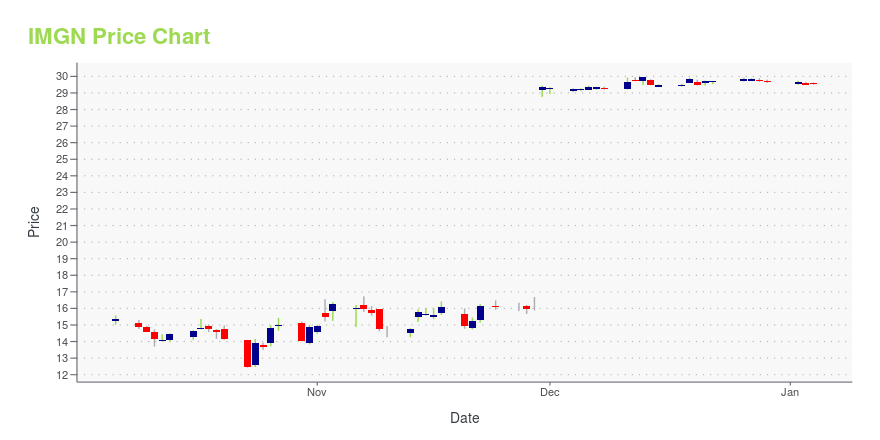
Current price | $15.52 | 52-week high | $15.60 |
Prev. close | $14.71 | 52-week low | $3.10 |
Day low | $14.66 | Volume | 2,061,607 |
Day high | $15.60 | Avg. volume | 5,403,194 |
50-day MA | $9.25 | Dividend yield | N/A |
200-day MA | $6.03 | Market Cap | 3.51B |
IMGN Stock Price Chart Interactive Chart >
IMGN POWR Grades
- IMGN scores best on the Sentiment dimension, with a Sentiment rank ahead of 73.44% of US stocks.
- The strongest trend for IMGN is in Sentiment, which has been heading up over the past 179 days.
- IMGN ranks lowest in Stability; there it ranks in the 3rd percentile.
IMGN Stock Summary
- The ratio of debt to operating expenses for IMMUNOGEN INC is higher than it is for about merely 9.27% of US stocks.
- IMGN's price/sales ratio is 25.63; that's higher than the P/S ratio of 94.94% of US stocks.
- The volatility of IMMUNOGEN INC's share price is greater than that of 92.33% US stocks with at least 200 days of trading history.
- Stocks with similar financial metrics, market capitalization, and price volatility to IMMUNOGEN INC are BGRY, ABEO, SRZN, ONTX, and MRNS.
- Visit IMGN's SEC page to see the company's official filings. To visit the company's web site, go to www.immunogen.com.
IMGN Valuation Summary
- IMGN's price/sales ratio is 26.2; this is 413.73% higher than that of the median Healthcare stock.
- Over the past 243 months, IMGN's price/sales ratio has gone up 6.1.
Below are key valuation metrics over time for IMGN.
Stock | Date | P/S | P/B | P/E | EV/EBIT |
---|---|---|---|---|---|
IMGN | 2023-05-23 | 26.2 | 25.9 | -13.2 | -12.5 |
IMGN | 2023-05-22 | 27.2 | 26.9 | -13.7 | -13.0 |
IMGN | 2023-05-19 | 26.7 | 26.4 | -13.4 | -12.7 |
IMGN | 2023-05-18 | 25.7 | 25.5 | -12.9 | -12.2 |
IMGN | 2023-05-17 | 26.1 | 25.8 | -13.1 | -12.4 |
IMGN | 2023-05-16 | 25.7 | 25.4 | -12.9 | -12.2 |
IMGN Growth Metrics
- The 4 year cash and equivalents growth rate now stands at 95.39%.
- Its 5 year net income to common stockholders growth rate is now at 37.06%.
- The year over year cash and equivalents growth rate now stands at 54.58%.

The table below shows IMGN's growth in key financial areas (numbers in millions of US dollars).
Date | Revenue | Operating Cash Flow | Net Income to Common Stock |
---|---|---|---|
2022-09-30 | 95.607 | -215.477 | -201.093 |
2022-06-30 | 89.442 | -186.309 | -160.677 |
2022-03-31 | 92.228 | -166.197 | -129.397 |
2021-12-31 | 69.856 | -169.416 | -139.303 |
2021-09-30 | 127.662 | -115.007 | -70.743 |
2021-06-30 | 136.641 | -110.612 | -55.778 |
IMGN's Quality Factors
The “Quality” component of the POWR Ratings focuses on 31 different factors of a companies fundamentals and operational strength. Here are some key insights as we drill into the specifics of these quality attributes.- IMGN has a Quality Grade of C, ranking ahead of 34.67% of graded US stocks.
- IMGN's asset turnover comes in at 0.393 -- ranking 121st of 682 Pharmaceutical Products stocks.
- TARO, HTBX, and ENTA are the stocks whose asset turnover ratios are most correlated with IMGN.
The table below shows IMGN's key quality metrics over time.
Period | Asset Turnover | Gross Margin | ROIC |
---|---|---|---|
2021-09-30 | 0.393 | 1 | 1.722 |
2021-06-30 | 0.437 | 1 | 1.612 |
2021-03-31 | 0.442 | 1 | 1.694 |
2020-12-31 | 0.452 | 1 | 2.339 |
2020-09-30 | 0.347 | 1 | 9.437 |
2020-06-30 | 0.327 | 1 | 10.967 |
IMGN Price Target
For more insight on analysts targets of IMGN, see our IMGN price target page. And for a list of of all stocks sorted by upside potential based on analyst target price, see our Top Price Target page.
Average Price Target | $9.79 | Average Broker Recommendation | 1.55 (Moderate Buy) |
ImmunoGen, Inc. (IMGN) Company Bio
Immunogen develops targeted anticancer therapeutics. The Company's ADC technology uses tumor-targeting antibodies to deliver an ImmunoGen cell-killing agent specifically to cancer cells. The company was founded in 1981 and is based in Waltham, Massachusetts.
Latest IMGN News From Around the Web
Below are the latest news stories about IMMUNOGEN INC that investors may wish to consider to help them evaluate IMGN as an investment opportunity.
Dr. Reddy's (RDY) Meets Goals in Actemra Biosimilar StudyDr. Reddy's (RDY) announces meeting primary and secondary endpoints in the phase I study of its proposed tocilizumab biosimilar for the treatment of rheumatoid arthritis in adults. |
An Intrinsic Calculation For ImmunoGen, Inc. (NASDAQ:IMGN) Suggests It's 47% UndervaluedKey Insights The projected fair value for ImmunoGen is US$29.06 based on 2 Stage Free Cash Flow to Equity Current share... |
Today’s Biggest Pre-Market Stock Movers: 10 Top Gainers and Losers on MondayIt's time to start the week off right with a breakdown of the biggest pre-market stock movers worth watching on Monday morning! |
ImmunoGen, Day One Surge On Cancer Drug Updates, But Arcus DipsImmunoGen and Day One unveiled promising cancer treatment updates over the weekend, leading IMGN stock and DAWN stock to soar Monday. |
ELAHERE® Demonstrates 35% Reduction in the Risk of Disease Progression or Death Versus Chemotherapy in FRα-Positive Platinum-Resistant Ovarian CancerWALTHAM, Mass., June 04, 2023--ELAHERE® Demonstrates 35% Reduction in the Risk of Disease Progression or Death Versus Chemotherapy in FRα-Positive Platinum-Resistant Ovarian Cancer |
IMGN Price Returns
1-mo | 12.87% |
3-mo | 310.58% |
6-mo | 201.95% |
1-year | 285.11% |
3-year | 223.33% |
5-year | 55.12% |
YTD | 212.90% |
2022 | -33.15% |
2021 | 15.04% |
2020 | 26.35% |
2019 | 6.35% |
2018 | -25.12% |
Continue Researching IMGN
Want to see what other sources are saying about ImmunoGen Inc's financials and stock price? Try the links below:ImmunoGen Inc (IMGN) Stock Price | Nasdaq
ImmunoGen Inc (IMGN) Stock Quote, History and News - Yahoo Finance
ImmunoGen Inc (IMGN) Stock Price and Basic Information | MarketWatch
Loading social stream, please wait...