Immersion Corporation (IMMR): Price and Financial Metrics
GET POWR RATINGS... FREE!
IMMR POWR Grades
- Value is the dimension where IMMR ranks best; there it ranks ahead of 84.36% of US stocks.
- IMMR's strongest trending metric is Quality; it's been moving down over the last 179 days.
- IMMR's current lowest rank is in the Stability metric (where it is better than 10.95% of US stocks).
IMMR Stock Summary
- For IMMR, its debt to operating expenses ratio is greater than that reported by merely 0.5% of US equities we're observing.
- Over the past twelve months, IMMR has reported earnings growth of 447.33%, putting it ahead of 95.11% of US stocks in our set.
- Immersion Corp's shareholder yield -- a measure of how much capital is returned to stockholders via dividends and buybacks -- is -34.23%, greater than the shareholder yield of only 11.69% of stocks in our set.
- If you're looking for stocks that are quantitatively similar to Immersion Corp, a group of peers worth examining would be QTRX, AUPH, NVVE, CNTG, and CASI.
- Visit IMMR's SEC page to see the company's official filings. To visit the company's web site, go to www.immersion.com.
IMMR Valuation Summary
- IMMR's price/sales ratio is 6.8; this is 24.77% higher than that of the median Technology stock.
- Over the past 243 months, IMMR's EV/EBIT ratio has gone up 11.2.
- IMMR's EV/EBIT ratio has moved up 11.2 over the prior 243 months.
Below are key valuation metrics over time for IMMR.
Stock | Date | P/S | P/B | P/E | EV/EBIT |
---|---|---|---|---|---|
IMMR | 2021-09-01 | 6.8 | 2.2 | 13.5 | 8.4 |
IMMR | 2021-08-31 | 6.7 | 2.2 | 13.5 | 8.4 |
IMMR | 2021-08-30 | 6.8 | 2.2 | 13.6 | 8.5 |
IMMR | 2021-08-27 | 6.8 | 2.2 | 13.6 | 8.5 |
IMMR | 2021-08-26 | 6.6 | 2.2 | 13.3 | 8.2 |
IMMR | 2021-08-25 | 6.7 | 2.2 | 13.4 | 8.3 |
IMMR Growth Metrics
- The 4 year net cashflow from operations growth rate now stands at -60.82%.
- The 2 year net cashflow from operations growth rate now stands at -149.1%.
- Its year over year net cashflow from operations growth rate is now at 120.65%.

The table below shows IMMR's growth in key financial areas (numbers in millions of US dollars).
Date | Revenue | Operating Cash Flow | Net Income to Common Stock |
---|---|---|---|
2021-12-31 | 35.089 | 17.449 | 12.484 |
2021-09-30 | 36.277 | 13.732 | 19.234 |
2021-06-30 | 36.7 | 13.844 | 18.318 |
2021-03-31 | 31.358 | 5.748 | 12.265 |
2020-12-31 | 30.456 | 0.022 | 5.401 |
2020-09-30 | 30.985 | -6.221 | -1.706 |
IMMR's Quality Factors
The “Quality” component of the POWR Ratings focuses on 31 different factors of a companies fundamentals and operational strength. Here are some key insights as we drill into the specifics of these quality attributes.- IMMR has a Quality Grade of A, ranking ahead of 97.21% of graded US stocks.
- IMMR's asset turnover comes in at 0.318 -- ranking 72nd of 83 Computers stocks.
- CSCO, DBD, and LTRX are the stocks whose asset turnover ratios are most correlated with IMMR.
The table below shows IMMR's key quality metrics over time.
Period | Asset Turnover | Gross Margin | ROIC |
---|---|---|---|
2021-06-30 | 0.318 | 0.996 | 0.663 |
2021-03-31 | 0.309 | 0.995 | 0.415 |
2020-12-31 | 0.323 | 0.994 | 0.137 |
2020-09-30 | 0.306 | 0.994 | -0.063 |
2020-06-30 | 0.305 | 0.994 | -0.229 |
2020-03-31 | 0.300 | 0.995 | -0.559 |
IMMR Price Target
For more insight on analysts targets of IMMR, see our IMMR price target page. And for a list of of all stocks sorted by upside potential based on analyst target price, see our Top Price Target page.
Average Price Target | $15.00 | Average Broker Recommendation | 1.25 (Strong Buy) |
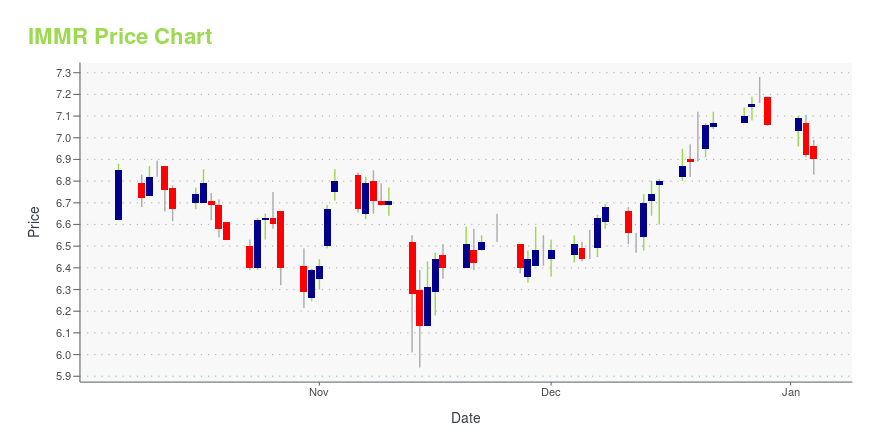
IMMR Stock Price Chart Interactive Chart >
IMMR Price/Volume Stats
Current price | $5.32 | 52-week high | $9.78 |
Prev. close | $5.18 | 52-week low | $4.28 |
Day low | $5.16 | Volume | 237,900 |
Day high | $5.35 | Avg. volume | 419,773 |
50-day MA | $5.07 | Dividend yield | N/A |
200-day MA | $5.95 | Market Cap | 178.83M |
Immersion Corporation (IMMR) Company Bio
Immersion Corporation provides haptic technologies and software that allow people to use their sense of touch when operating various digital devices. The company was founded in 1993 and is based in San Jose, California.
Latest IMMR News From Around the Web
Below are the latest news stories about Immersion Corp that investors may wish to consider to help them evaluate IMMR as an investment opportunity.
Immersion Non-GAAP EPS of $0.17, revenue of $9.7MImmersion press release (NASDAQ:IMMR): Q4 Non-GAAP EPS of $0.17. Revenue of $9.7M (-11.0% Y/Y). CEO comment: “We are currently focused on pursuing opportunities to drive the adoption of our haptics intellectual property in the automotive industry, especially in the burgeoning electric vehicle market; establishing industry technical standards for haptics in... |
Immersion Corporation Reports Fourth Quarter 2021 ResultsSAN FRANCISCO, February 24, 2022--Immersion Corporation (NASDAQ: IMMR), the leading developer and provider of technologies for haptics, today reported financial results for the fourth quarter ended December 31, 2021. |
Immersion and Nissha Partner on New Automotive Interface DesignsSAN FRANCISCO, February 23, 2022--Immersion Corporation (NASDAQ: IMMR), the leading licensor of haptic technologies, and Nissha, a global supplier of touch sensors, decorative film and molded parts, announced a partnership to integrate Immersion’s haptics technology into automotive interface solutions. Under the agreement, Immersion will license its Active Sensing™ technology and patents to Nissha. |
Immersion Signs License Agreement with Duck-il for Automotive InterfacesSAN FRANCISCO, February 22, 2022--Immersion Corporation (NASDAQ: IMMR), the leading licensor of haptic technologies, announced it has signed a license agreement with Duck-il, a Korea-based automotive supplier, for use of its technology in automotive interfaces. |
Zacks Industry Outlook Highlights: Logitech, Mercury Systems, Stratasys and ImmersionLogitech, Mercury Systems, Stratasys and Immersion are highlighted in this Industry Outlook article. |
IMMR Price Returns
1-mo | 15.90% |
3-mo | 4.52% |
6-mo | -6.67% |
1-year | -37.04% |
3-year | -30.64% |
5-year | -36.89% |
YTD | -6.83% |
2021 | -49.42% |
2020 | 51.95% |
2019 | -17.08% |
2018 | 26.91% |
2017 | -33.58% |
Continue Researching IMMR
Want to see what other sources are saying about Immersion Corp's financials and stock price? Try the links below:Immersion Corp (IMMR) Stock Price | Nasdaq
Immersion Corp (IMMR) Stock Quote, History and News - Yahoo Finance
Immersion Corp (IMMR) Stock Price and Basic Information | MarketWatch
Loading social stream, please wait...