ChipMOS TECHNOLOGIES INC. (IMOS): Price and Financial Metrics
ChipMOS TECHNOLOGIES INC. (IMOS)
Today's Latest Price: $26.31 USD
Updated Jan 21 1:12pm
Add IMOS to WatchlistSign Up
POWR Components:
Trade Grade Buy & Hold Grade Peer Grade Industry Rank
Industry Rank:
Ranked of 99 in Semiconductor & Wireless Chip
See all "A" rated Strong Buy stocks
IMOS Stock Summary
- IMOS's current price/earnings ratio is 0.37, which is higher than just 0.29% of US stocks with positive earnings.
- With a price/sales ratio of 0.05, Chipmos Technologies Inc has a higher such ratio than only 0.79% of stocks in our set.
- Chipmos Technologies Inc's shareholder yield -- a measure of how much capital is returned to stockholders via dividends and buybacks -- is 180.83%, greater than the shareholder yield of 98.31% of stocks in our set.
- Stocks that are quantitatively similar to IMOS, based on their financial statements, market capitalization, and price volatility, are GNFT, VNE, DRRX, PZG, and HIMX.
- IMOS's SEC filings can be seen here. And to visit Chipmos Technologies Inc's official web site, go to www.chipmos.com.
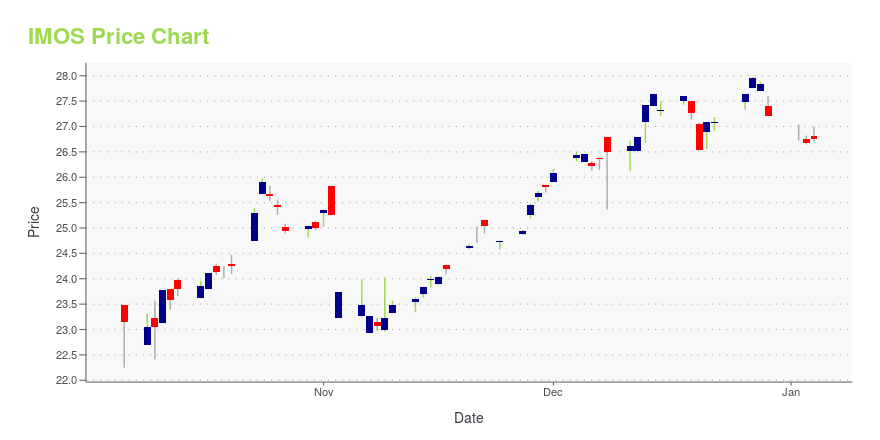
IMOS Stock Price Chart Interactive Chart >
IMOS Price/Volume Stats
Current price | $26.31 | 52-week high | $26.61 |
Prev. close | $25.51 | 52-week low | $15.00 |
Day low | $26.30 | Volume | 8,948 |
Day high | $26.45 | Avg. volume | 12,685 |
50-day MA | $23.67 | Dividend yield | 3.72% |
200-day MA | $21.33 | Market Cap | 1.17B |
ChipMOS TECHNOLOGIES INC. (IMOS) Company Bio
ChipMOS Technologies provides assembly and test services to a broad range of customers, including leading fabless semiconductor companies, integrated device manufacturers and independent semiconductor foundries. The company was founded in 1986 and is based in Hsinchu, Taiwan.
IMOS Price Forecast Based on DCF Valuation
Current Price | DCF Fair Value Target: | Forecasted Gain: |
$26.31 | $613.43 | 2305% |
We started the process of determining a valid price forecast for Chipmos Technologies Inc with a discounted cash flow analysis -- the results of which can be found in the table below. To summarize, we found that Chipmos Technologies Inc ranked in the 92th percentile in terms of potential gain offered. Moreover, under all the scenarios we modelled, the output consistently forecasted positive returns. In terms of the factors that were most noteworthy in this DCF analysis for IMOS, they are:
- The company's balance sheet shows it gets 66% of its capital from equity, and 34% of its capital from debt. Its equity weight surpasses that of merely 9.52% of free cash flow generating stocks in the Technology sector.
- Chipmos Technologies Inc's weighted average cost of capital (WACC) is 8%; for context, that number is higher than just 3.92% of tickers in our DCF set.
- IMOS's estimated cost of debt, based largely on its market capitalization and its interest coverage ratio, is 3%; for context, that number is higher than just 3.92% of tickers in our DCF set.
Terminal Growth Rate in Free Cash Flow | Return Relative to Current Share Price |
0% | 2258% |
1% | 2281% |
2% | 2305% |
3% | 2328% |
4% | 2352% |
5% | 2375% |
ZS, SNX, KYOCY, TRCK, and SCSC can be thought of as valuation peers to IMOS, in the sense that they are in the Technology sector and have a similar price forecast based on DCF valuation.
Loading social stream, please wait...