Incyte Corp. (INCY): Price and Financial Metrics


Incyte Corp. (INCY): $72.27

1.23 (+1.73%)

POWR Rating

Component Grades

Growth

S

Value

I

Momentum

G

Stability

N

Sentiment

U

Quality

P

Add INCY to Watchlist
Sign Up

Industry: Biotech


Ranked

of

in industry

INCY POWR Grades

  • INCY scores best on the Quality dimension, with a Quality rank ahead of 97.17% of US stocks.
  • INCY's strongest trending metric is Momentum; it's been moving up over the last 177 days.
  • INCY's current lowest rank is in the Momentum metric (where it is better than 32.8% of US stocks).

INCY Stock Summary

  • With a market capitalization of $15,658,833,214, INCYTE CORP has a greater market value than 88.05% of US stocks.
  • With a price/earnings ratio of 45.97, INCYTE CORP P/E ratio is greater than that of about 87.59% of stocks in our set with positive earnings.
  • The ratio of debt to operating expenses for INCYTE CORP is higher than it is for about just 5.56% of US stocks.
  • If you're looking for stocks that are quantitatively similar to INCYTE CORP, a group of peers worth examining would be QRVO, EXK, EXEL, BCDA, and SLAB.
  • Visit INCY's SEC page to see the company's official filings. To visit the company's web site, go to www.incyte.com.

INCY Valuation Summary

  • INCY's EV/EBIT ratio is 24; this is 263.64% higher than that of the median Healthcare stock.
  • Over the past 243 months, INCY's price/sales ratio has gone up 2.5.

Below are key valuation metrics over time for INCY.

Stock Date P/S P/B P/E EV/EBIT
INCY 2023-03-24 4.6 3.6 46.0 24.0
INCY 2023-03-23 4.7 3.7 47.3 24.8
INCY 2023-03-22 4.7 3.7 47.3 24.8
INCY 2023-03-21 4.8 3.7 48.1 25.3
INCY 2023-03-20 4.9 3.8 48.6 25.6
INCY 2023-03-17 4.8 3.8 48.2 25.4

INCY Growth Metrics

    Its 3 year revenue growth rate is now at 55.94%.
  • Its 2 year revenue growth rate is now at 39.71%.
  • Its 3 year net income to common stockholders growth rate is now at 268.87%.
INCY's revenue has moved up $1,165,226,000 over the prior 34 months.

The table below shows INCY's growth in key financial areas (numbers in millions of US dollars).

Date Revenue Operating Cash Flow Net Income to Common Stock
2022-12-31 3,394.635 969.941 340.66
2022-09-30 3,330.788 801.63 876.05
2022-06-30 3,320.472 760.347 945.014
2022-03-31 3,114.784 759.134 933.038
2021-12-31 2,986.267 749.488 948.581
2021-09-30 2,912.923 741.458 534.58

INCY's Quality Factors

The “Quality” component of the POWR Ratings focuses on 31 different factors of a companies fundamentals and operational strength. Here are some key insights as we drill into the specifics of these quality attributes.
  • INCY has a Quality Grade of A, ranking ahead of 95.94% of graded US stocks.
  • INCY's asset turnover comes in at 0.76 -- ranking 198th of 563 Business Services stocks.
  • TSSI, APDN, and NUAN are the stocks whose asset turnover ratios are most correlated with INCY.

The table below shows INCY's key quality metrics over time.

Period Asset Turnover Gross Margin ROIC
2021-09-30 0.760 0.951 0.546
2021-06-30 0.754 0.949 0.381
2021-03-31 0.787 0.951 0.523
2020-12-31 0.831 0.951 -0.231
2020-09-30 0.774 0.948 -0.298
2020-06-30 0.758 0.949 -0.138

INCY Price Target

For more insight on analysts targets of INCY, see our INCY price target page. And for a list of of all stocks sorted by upside potential based on analyst target price, see our Top Price Target page.

Average Price Target $102.47 Average Broker Recommendation 1.56 (Moderate Buy)

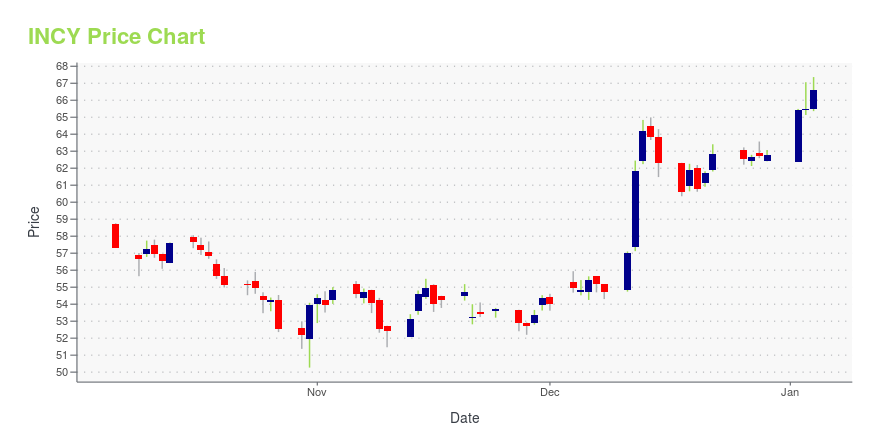
INCY Stock Price Chart Interactive Chart >

Price chart for INCY

INCY Price/Volume Stats

Current price $72.27 52-week high $86.29
Prev. close $71.04 52-week low $65.07
Day low $70.96 Volume 1,960,900
Day high $72.37 Avg. volume 1,690,771
50-day MA $77.68 Dividend yield N/A
200-day MA $76.06 Market Cap 16.11B

Incyte Corp. (INCY) Company Bio


ncyte is an American multinational pharmaceutical company with headquarters in Wilmington, Delaware, and Morges, Switzerland. The company was created in 2002 through the merger of Incyte Pharmaceuticals, founded in Palo Alto, California in 1991 and Incyte Genomics, Inc. of Delaware. The company currently operates manufacturing and R&D locations in North America, Europe, and Asia. (Source:Wikipedia)


INCY Latest News Stream


Event/Time News Detail
Loading, please wait...

INCY Latest Social Stream


Loading social stream, please wait...

View Full INCY Social Stream

Latest INCY News From Around the Web

Below are the latest news stories about INCYTE CORP that investors may wish to consider to help them evaluate INCY as an investment opportunity.

Biotech Stock Roundup: VKTX, BMEA, ITCI Soar on Study Data, INCY Faces Setback

Pipelines updates from Viking Therapeutics (VKTX) and Intra-Cellular (ITCI) are the key highlights for the biotech sector.

Yahoo | March 29, 2023

Incyte's (INCY) Pemazyre Gets Approval to Treat MLNs in Japan

Incyte (INCY) receives approval for treating myeloid or lymphoid neoplasms using Pemazyre (pemigatinib) in Japan.

Yahoo | March 27, 2023

Company News for Mar 27, 2023

Companies in The News Are: SQ,INCY,JPM,WFC

Yahoo | March 27, 2023

Incyte Announces Japanese Approval of Pemazyre® (pemigatinib) for the Treatment of Patients with Myeloid/Lymphoid Neoplasms (MLNs)

WILMINGTON, Del. & TOKYO, March 27, 2023--Incyte Announces Japanese Approval of Pemazyre® (pemigatinib) for the Treatment of Patients with Myeloid/Lymphoid Neoplasms (MLNs)

Yahoo | March 27, 2023

Second Setback For Incyte's LIMBER Program - Analyst Says 'Resolution Timelines Unclear To Assess Impact'

The FDA issued a complete response letter (CRL) to Incyte Corporation (NASDAQ: INCY) ruxolitinib extended-release (XR) tablets, a JAK1/JAK2 inhibitor, for once-daily (QD) use for certain types of myelofibrosis (MF), polycythemia vera (PV) and graft-versus-host disease (GVHD). The complete response letter states that the FDA cannot approve the application in its present form. The FDA acknowledged that the study submitted in the marketing application met its objective of bioequivalence based on ar

Yahoo | March 24, 2023

Read More 'INCY' Stories Here

INCY Price Returns

1-mo -6.52%
3-mo -10.02%
6-mo 5.00%
1-year -9.59%
3-year -2.57%
5-year -10.29%
YTD -10.02%
2022 9.43%
2021 -15.61%
2020 -0.39%
2019 37.32%
2018 -32.86%

Get Free Updates

Join thousands of investors who get the latest news, insights and top rated picks from StockNews.com!


Page generated in 0.7222 seconds.