
Indonesia Energy Corp. Ltd. (INDO): Price and Financial Metrics
INDO Price/Volume Stats
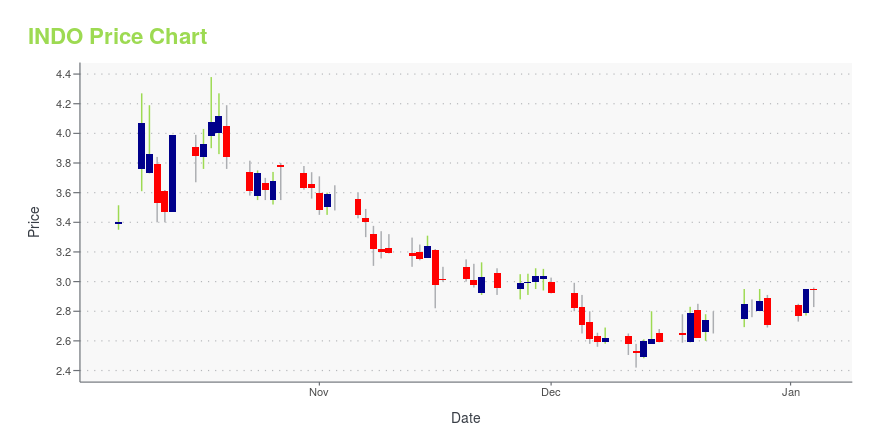
| Current price | $2.12 | 52-week high | $6.65 |
| Prev. close | $2.15 | 52-week low | $2.03 |
| Day low | $2.10 | Volume | 48,149 |
| Day high | $2.18 | Avg. volume | 1,021,469 |
| 50-day MA | $2.81 | Dividend yield | N/A |
| 200-day MA | $2.99 | Market Cap | 21.63M |
INDO Stock Price Chart Interactive Chart >
Indonesia Energy Corp. Ltd. (INDO) Company Bio
Indonesia Energy Corporation provides exploration and production services. The Company engages in oil and gas business. Indonesia Energy serves customers in Indonesia.
Latest INDO News From Around the Web
Below are the latest news stories about INDONESIA ENERGY CORP LTD that investors may wish to consider to help them evaluate INDO as an investment opportunity.
Indonesia's $20 Billion Leap into Renewable EnergyIndonesia announces a significant $20 billion investment from global lenders to develop renewable energy, aiming to reduce grid emissions and increase renewable energy in its mix, despite current heavy reliance on coal. |
Indonesia Energy to Present at H.C. Wainwright 25th Annual Global Investment Conference On Tuesday, September 12, 2023President Frank Ingriselli Will Present Update on Development Plans and Recent Kruh Contract Extension JAKARTA, INDONESIA AND DANVILLE, CA, Sept. 08, 2023 (GLOBE NEWSWIRE) -- Indonesia Energy Corporation (NYSE American: INDO) ("IEC"), an oil and gas exploration and production company focused on Indonesia, today announced its President, Frank Ingriselli, will be presenting at the H.C. Wainwright 25th Annual Global Investment Conference on Tuesday, September 12 at 12:00PM EST. The in-person venue |
Indonesia Energy Announces Five-Year Extension of its Government Contract for Kruh BlockCompany’s Profit Share Increases by More Than 100% Proved Reserves Also Anticipated to Increase Given Extended Contract Term Company Also Provides Update on Development Plans for 2023 and 2024 JAKARTA, INDONESIA AND DANVILLE, CA, Sept. 07, 2023 (GLOBE NEWSWIRE) -- Indonesia Energy Corporation (NYSE American: INDO) ("IEC"), an oil and gas exploration and production company focused on Indonesia, today announced that its joint operation contract with Pertamina, the Indonesian state-owned oil and ga |
Indonesia Energy Announces Updates on Discovery Wells Drilled in 2022 and Development Plans for 2023Company negotiating for Kruh Block contract extension 2023 new seismic operations seek to maximize returns from the Kruh Block drilling program JAKARTA, INDONESIA AND DANVILLE, CA, March 27, 2023 (GLOBE NEWSWIRE) -- Indonesia Energy Corporation (NYSE American: INDO) ("IEC"), an oil and gas exploration and production company focused on Indonesia, today announced updates on its discovery wells drilled in 2022 and its ongoing development activities and plans for 2023 and beyond, including a potenti |
INDO Price Returns
| 1-mo | -23.47% |
| 3-mo | -51.26% |
| 6-mo | -19.08% |
| 1-year | -48.67% |
| 3-year | -57.43% |
| 5-year | N/A |
| YTD | -21.77% |
| 2023 | -41.85% |
| 2022 | 66.43% |
| 2021 | -62.67% |
| 2020 | 2.60% |
| 2019 | N/A |
Loading social stream, please wait...