
InfuSystems Holdings, Inc. (INFU): Price and Financial Metrics
INFU Price/Volume Stats
| Current price | $6.90 | 52-week high | $11.44 |
| Prev. close | $6.90 | 52-week low | $6.25 |
| Day low | $6.87 | Volume | 62,381 |
| Day high | $6.99 | Avg. volume | 50,965 |
| 50-day MA | $6.79 | Dividend yield | N/A |
| 200-day MA | $8.62 | Market Cap | 146.94M |
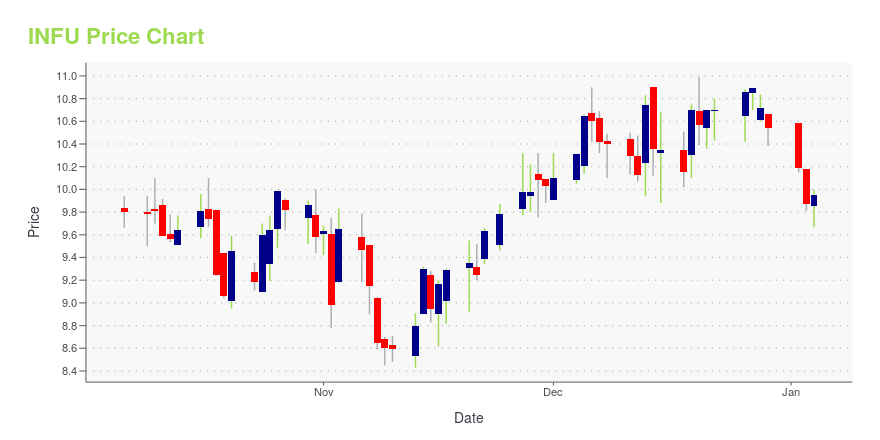
INFU Stock Price Chart Interactive Chart >
InfuSystems Holdings, Inc. (INFU) Company Bio
InfuSystem Holdings, Inc., through its subsidiaries, provides infusion pumps, and related products and services in the United States and Canada. It supplies electronic ambulatory infusion pumps and associated disposable supply kits to oncology clinics, infusion clinics, and hospital outpatient chemotherapy clinics for the treatment of various cancers, including colorectal cancer, pain management, and other disease states. The company also sells, rents, and leases new and pre-owned pole-mounted and ambulatory infusion pumps; and provides biomedical recertification, maintenance, and repair services for oncology practices, as well as other alternate site settings comprising home care and home infusion providers, skilled nursing facilities, pain centers, and others. In addition, it offers local and field-based customer support, as well as operates pump service and repair centers. The company was founded in 2005 and is headquartered in Madison Heights, Michigan.
Latest INFU News From Around the Web
Below are the latest news stories about INFUSYSTEM HOLDINGS INC that investors may wish to consider to help them evaluate INFU as an investment opportunity.
Sidoti Events, LLC's Virtual December Small-Cap ConferenceNEW YORK, NY / ACCESSWIRE / December 5, 2023 / Sidoti Events, LLC, an affiliate of Sidoti & Company, LLC, has released the presentation schedule and weblinks for its two-day December Small-Cap Conference taking place Wednesday and Thursday, December ... |
InfuSystem to Present at Sidoti Small-Cap Virtual Conference on December 6, 2023ROCHESTER HILLS, Mich., November 28, 2023--InfuSystem to Present at Sidoti Small-Cap Virtual Conference on December 6, 2023 |
InfuSystem to Participate at 14th Annual Craig-Hallum Alpha Select Conference on November 16, 2023ROCHESTER HILLS, Mich., November 09, 2023--InfuSystem to Participate at 14th Annual Craig-Hallum Alpha Select Conference on November 16, 2023 |
InfuSystem Holdings, Inc. (AMEX:INFU) Q3 2023 Earnings Call TranscriptInfuSystem Holdings, Inc. (AMEX:INFU) Q3 2023 Earnings Call Transcript November 7, 2023 InfuSystem Holdings, Inc. beats earnings expectations. Reported EPS is $0.03, expectations were $0.02. Operator: Good day and welcome to the InfuSystem Holdings Inc. reports Third Quarter 2023 Financial Results Conference Call. All participants will be in a listen-only mode. [Operator Instructions] Please note […] |
Q3 2023 InfuSystem Holdings Inc Earnings CallQ3 2023 InfuSystem Holdings Inc Earnings Call |
INFU Price Returns
| 1-mo | 0.73% |
| 3-mo | -15.02% |
| 6-mo | -28.35% |
| 1-year | -32.42% |
| 3-year | -63.12% |
| 5-year | 49.03% |
| YTD | -34.54% |
| 2023 | 21.43% |
| 2022 | -49.03% |
| 2021 | -9.32% |
| 2020 | 120.16% |
| 2019 | 147.97% |
Continue Researching INFU
Want to see what other sources are saying about InfuSystem Holdings Inc's financials and stock price? Try the links below:InfuSystem Holdings Inc (INFU) Stock Price | Nasdaq
InfuSystem Holdings Inc (INFU) Stock Quote, History and News - Yahoo Finance
InfuSystem Holdings Inc (INFU) Stock Price and Basic Information | MarketWatch
Loading social stream, please wait...