Inogen, Inc (INGN): Price and Financial Metrics
GET POWR RATINGS... FREE!
INGN POWR Grades
- INGN scores best on the Value dimension, with a Value rank ahead of 75.76% of US stocks.
- The strongest trend for INGN is in Growth, which has been heading up over the past 177 days.
- INGN's current lowest rank is in the Momentum metric (where it is better than 12.61% of US stocks).
INGN Stock Summary
- INGN's one year PEG ratio, measuring expected growth in earnings next year relative to current common stock price is 0.32 -- higher than only 3.98% of US-listed equities with positive expected earnings growth.
- The ratio of debt to operating expenses for INOGEN INC is higher than it is for about just 15.06% of US stocks.
- Over the past twelve months, INGN has reported earnings growth of -1,061.63%, putting it ahead of merely 1.76% of US stocks in our set.
- Stocks with similar financial metrics, market capitalization, and price volatility to INOGEN INC are TRVG, ASUR, OGI, KAMN, and IAC.
- Visit INGN's SEC page to see the company's official filings. To visit the company's web site, go to www.inogen.com.
INGN Valuation Summary
- INGN's EV/EBIT ratio is -1.5; this is 122.73% lower than that of the median Healthcare stock.
- INGN's EV/EBIT ratio has moved down 63.2 over the prior 111 months.
Below are key valuation metrics over time for INGN.
Stock | Date | P/S | P/B | P/E | EV/EBIT |
---|---|---|---|---|---|
INGN | 2023-03-24 | 0.8 | 1 | -3.4 | -1.5 |
INGN | 2023-03-23 | 0.8 | 1 | -3.5 | -1.5 |
INGN | 2023-03-22 | 0.8 | 1 | -3.5 | -1.5 |
INGN | 2023-03-21 | 0.8 | 1 | -3.7 | -1.7 |
INGN | 2023-03-20 | 0.8 | 1 | -3.5 | -1.5 |
INGN | 2023-03-17 | 0.8 | 1 | -3.5 | -1.5 |
INGN Growth Metrics
- The 3 year price growth rate now stands at -73.57%.
- Its 2 year cash and equivalents growth rate is now at 2.42%.
- The 3 year revenue growth rate now stands at -4.82%.

The table below shows INGN's growth in key financial areas (numbers in millions of US dollars).
Date | Revenue | Operating Cash Flow | Net Income to Common Stock |
---|---|---|---|
2022-12-31 | 377.241 | -37.532 | -83.772 |
2022-09-30 | 365.553 | -15.552 | -50.039 |
2022-06-30 | 353.269 | -9.063 | -28.359 |
2022-03-31 | 351.456 | 2.675 | -19.815 |
2021-12-31 | 358.003 | 23.633 | -6.333 |
2021-09-30 | 355.578 | 33.333 | 11.423 |
INGN's Quality Factors
The “Quality” component of the POWR Ratings focuses on 31 different factors of a companies fundamentals and operational strength. Here are some key insights as we drill into the specifics of these quality attributes.- INGN has a Quality Grade of C, ranking ahead of 45.31% of graded US stocks.
- INGN's asset turnover comes in at 0.71 -- ranking 52nd of 186 Medical Equipment stocks.
- ATRC, BSX, and GKOS are the stocks whose asset turnover ratios are most correlated with INGN.
The table below shows INGN's key quality metrics over time.
Period | Asset Turnover | Gross Margin | ROIC |
---|---|---|---|
2021-06-30 | 0.710 | 0.467 | 0.022 |
2021-03-31 | 0.661 | 0.455 | -0.057 |
2020-12-31 | 0.671 | 0.448 | -0.053 |
2020-09-30 | 0.687 | 0.440 | -0.044 |
2020-06-30 | 0.731 | 0.448 | 0.060 |
2020-03-31 | 0.821 | 0.460 | 0.140 |
INGN Price Target
For more insight on analysts targets of INGN, see our INGN price target page. And for a list of of all stocks sorted by upside potential based on analyst target price, see our Top Price Target page.
Average Price Target | $71.00 | Average Broker Recommendation | 1.92 (Hold) |
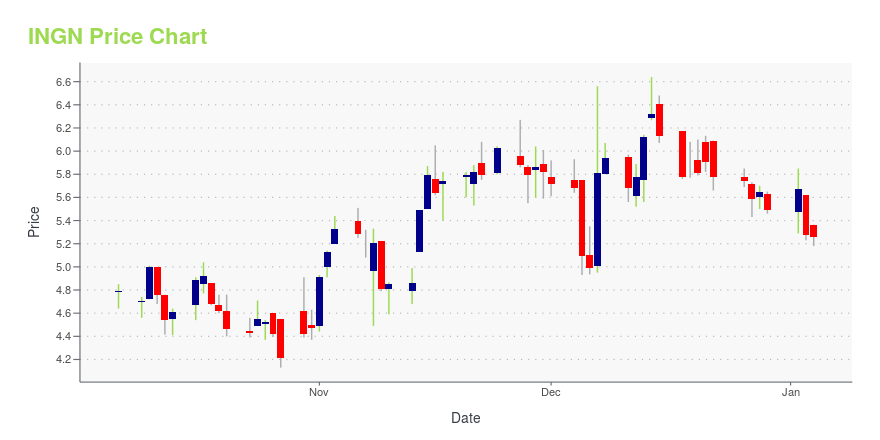
INGN Stock Price Chart Interactive Chart >
INGN Price/Volume Stats
Current price | $12.15 | 52-week high | $35.67 |
Prev. close | $11.88 | 52-week low | $11.60 |
Day low | $11.99 | Volume | 359,800 |
Day high | $12.35 | Avg. volume | 280,593 |
50-day MA | $18.67 | Dividend yield | N/A |
200-day MA | $22.98 | Market Cap | 279.09M |
Inogen, Inc (INGN) Company Bio
Inogen develops, manufactures, and markets portable oxygen concentrators for patients, physicians and other clinicians, and third-party payors in the United States and internationally. The company was founded in 2001 and is based in Goleta, California.
Latest INGN News From Around the Web
Below are the latest news stories about INOGEN INC that investors may wish to consider to help them evaluate INGN as an investment opportunity.
At US$12.41, Is Inogen, Inc. (NASDAQ:INGN) Worth Looking At Closely?While Inogen, Inc. ( NASDAQ:INGN ) might not be the most widely known stock at the moment, it received a lot of... |
Here's Why You Should Retain Inogen (INGN) Stock for NowInvestors continue to be optimistic about Inogen (INGN) on its potential in the POC space and a strong product portfolio. |
Inogen Announces Appointment of Tom West to Board of Directors and Retirement of Board Member Kristen MirandaGOLETA, Calif., March 22, 2023--Inogen Announces Appointment of Tom West to Board of Directors and Retirement of Board Member Kristen Miranda |
Strength Seen in Inogen (INGN): Can Its 5.0% Jump Turn into More Strength?Inogen (INGN) witnessed a jump in share price last session on above-average trading volume. The latest trend in earnings estimate revisions for the stock doesn't suggest further strength down the road. |
Inogen to Present at KeyBanc Life Sciences & MedTech Investor ForumGOLETA, Calif., March 08, 2023--Inogen to Present at KeyBanc Life Sciences & MedTech Investor Forum |
INGN Price Returns
1-mo | -21.92% |
3-mo | -38.36% |
6-mo | -49.96% |
1-year | -62.52% |
3-year | -76.48% |
5-year | -90.11% |
YTD | -38.36% |
2022 | -42.03% |
2021 | -23.90% |
2020 | -34.61% |
2019 | -44.97% |
2018 | 4.27% |
Continue Researching INGN
Want to see what other sources are saying about Inogen Inc's financials and stock price? Try the links below:Inogen Inc (INGN) Stock Price | Nasdaq
Inogen Inc (INGN) Stock Quote, History and News - Yahoo Finance
Inogen Inc (INGN) Stock Price and Basic Information | MarketWatch
Loading social stream, please wait...