InMed Pharmaceuticals Inc. (INM): Price and Financial Metrics
INM Price/Volume Stats
| Current price | $2.95 | 52-week high | $15.70 |
| Prev. close | $2.94 | 52-week low | $1.72 |
| Day low | $2.82 | Volume | 62,800 |
| Day high | $3.08 | Avg. volume | 372,794 |
| 50-day MA | $2.67 | Dividend yield | N/A |
| 200-day MA | $4.07 | Market Cap | 3.56M |
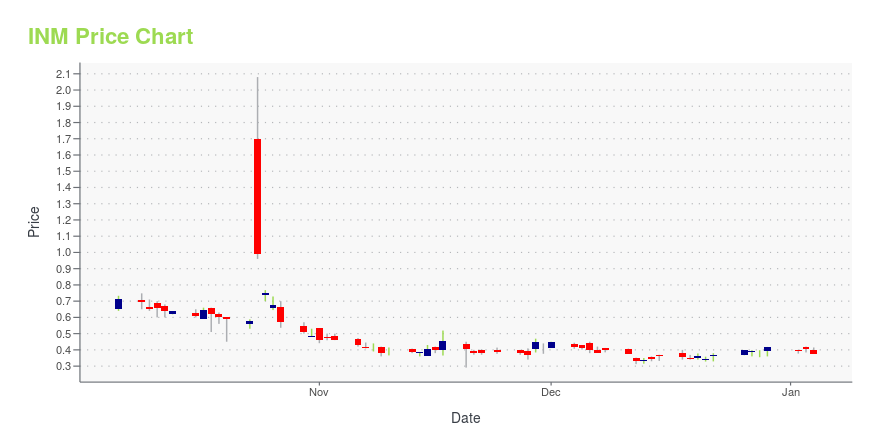
INM Stock Price Chart Interactive Chart >
InMed Pharmaceuticals Inc. (INM) Company Bio
InMed Pharmaceuticals Inc., a clinical stage pharmaceutical company, researches and develops cannabinoid-based therapies. The company's lead product is INM-755, a cannabinol topical cream, which is in a second Phase I clinical trials for the treatment of epidermolysis bullosa. The company is also involved in developing INM-088, which is in preclinical studies for the treatment of glaucoma; and INM-405 for the treatment of orofacial pain. In addition, it engages in the development of cannabinoid-based treatments for various diseases, including dermatology and ocular diseases. Further, the company works on IND-enabling pharmacology and preclinical toxicology studies. It has a research collaboration agreement with BayMedica Inc. for the manufacturing and testing of novel cannabinoid therapeutics. The company was formerly known as Cannabis Technologies Inc. and changed its name to InMed Pharmaceuticals Inc. in October 2014. InMed Pharmaceuticals Inc. was incorporated in 1981 and is based in Vancouver, Canada.
INM Price Returns
| 1-mo | 8.61% |
| 3-mo | -6.65% |
| 6-mo | -30.42% |
| 1-year | -49.98% |
| 3-year | -99.24% |
| 5-year | -99.92% |
| YTD | -37.76% |
| 2024 | -43.03% |
| 2023 | -79.41% |
| 2022 | -93.83% |
| 2021 | -60.18% |
| 2020 | -44.61% |


Loading social stream, please wait...