Innodata Inc. (INOD): Price and Financial Metrics
GET POWR RATINGS... FREE!
INOD Price/Volume Stats
Current price | $11.30 | 52-week high | $11.40 |
Prev. close | $9.72 | 52-week low | $2.78 |
Day low | $9.65 | Volume | 1,090,300 |
Day high | $11.40 | Avg. volume | 202,508 |
50-day MA | $8.00 | Dividend yield | N/A |
200-day MA | $4.98 | Market Cap | 311.32M |
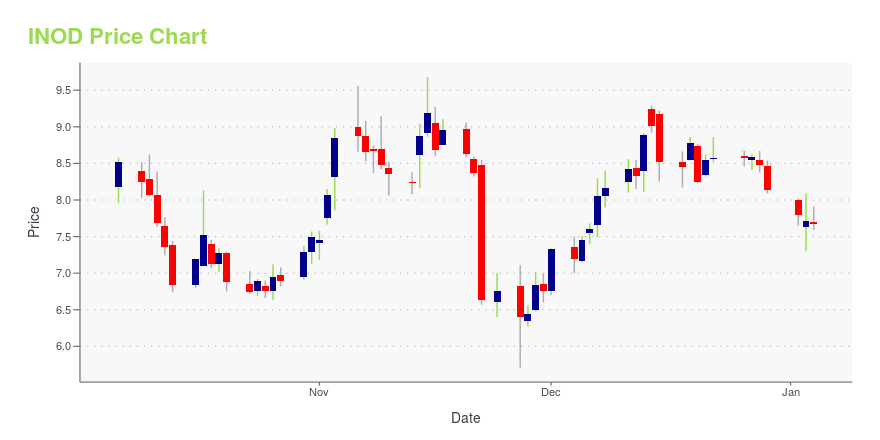
INOD Stock Price Chart Interactive Chart >
INOD POWR Grades
- Quality is the dimension where INOD ranks best; there it ranks ahead of 47.49% of US stocks.
- The strongest trend for INOD is in Momentum, which has been heading down over the past 89 days.
- INOD ranks lowest in Momentum; there it ranks in the 2nd percentile.
INOD Stock Summary
- Price to trailing twelve month operating cash flow for INOD is currently 117.59, higher than 97.06% of US stocks with positive operating cash flow.
- In terms of twelve month growth in earnings before interest and taxes, INNODATA INC is reporting a growth rate of 174.16%; that's higher than 92.16% of US stocks.
- In terms of volatility of its share price, INOD is more volatile than 91.83% of stocks we're observing.
- Stocks that are quantitatively similar to INOD, based on their financial statements, market capitalization, and price volatility, are AIR, AAON, PESI, PLXS, and III.
- Visit INOD's SEC page to see the company's official filings. To visit the company's web site, go to www.innodata.com.
INOD Valuation Summary
- In comparison to the median Technology stock, INOD's price/sales ratio is 46.94% higher, now standing at 3.6.
- Over the past 243 months, INOD's EV/EBIT ratio has gone down 25.8.
Below are key valuation metrics over time for INOD.
Stock | Date | P/S | P/B | P/E | EV/EBIT |
---|---|---|---|---|---|
INOD | 2023-05-22 | 3.6 | 14.5 | -24.6 | -28.0 |
INOD | 2023-05-19 | 3.6 | 14.3 | -24.3 | -27.6 |
INOD | 2023-05-18 | 3.6 | 14.4 | -24.5 | -27.9 |
INOD | 2023-05-17 | 3.0 | 11.9 | -20.3 | -23.1 |
INOD | 2023-05-16 | 3.1 | 12.4 | -21.2 | -24.1 |
INOD | 2023-05-15 | 3.5 | 14.0 | -23.8 | -27.1 |
INOD Growth Metrics
- Its 3 year net cashflow from operations growth rate is now at -28.5%.
- Its year over year revenue growth rate is now at 25.64%.
- Its 2 year net cashflow from operations growth rate is now at -16.12%.

The table below shows INOD's growth in key financial areas (numbers in millions of US dollars).
Date | Revenue | Operating Cash Flow | Net Income to Common Stock |
---|---|---|---|
2022-12-31 | 79.001 | -1.216 | -11.935 |
2022-09-30 | 78.915 | -2.151 | -11.143 |
2022-06-30 | 77.918 | -4.307 | -8.616 |
2022-03-31 | 74.98 | 2.898 | -4.886 |
2021-12-31 | 69.755 | 5.151 | -1.673 |
2021-09-30 | 65.76 | 5.649 | 0.828 |
INOD's Quality Factors
The “Quality” component of the POWR Ratings focuses on 31 different factors of a companies fundamentals and operational strength. Here are some key insights as we drill into the specifics of these quality attributes.- INOD has a Quality Grade of B, ranking ahead of 87.9% of graded US stocks.
- INOD's asset turnover comes in at 1.101 -- ranking 109th of 561 Business Services stocks.
- ADS, FORR, and YEXT are the stocks whose asset turnover ratios are most correlated with INOD.
The table below shows INOD's key quality metrics over time.
Period | Asset Turnover | Gross Margin | ROIC |
---|---|---|---|
2021-06-30 | 1.101 | 0.372 | 0.080 |
2021-03-31 | 1.091 | 0.351 | 0.054 |
2020-12-31 | 1.102 | 0.341 | 0.043 |
2020-09-30 | 1.130 | 0.334 | 0.019 |
2020-06-30 | 1.127 | 0.339 | 0.008 |
2020-03-31 | 1.115 | 0.338 | 0.002 |
Latest INOD News From Around the Web
Below are the latest news stories about INNODATA INC that investors may wish to consider to help them evaluate INOD as an investment opportunity.
Q1 2023 Innodata Inc Earnings CallQ1 2023 Innodata Inc Earnings Call |
Innodata Announces Potentially Transformative Deals in Generative AI with Three of the Largest Global Tech Companies and Reports First Quarter 2023 ResultsINNODATA INC. (NASDAQ:INOD)today reported results for the first quarter ended March 31, 2023. |
Innodata to Report First Quarter 2023 ResultsINNODATA INC. (NASDAQ:INOD)today announced that it will report First Quarter 2023 results after the market closes on Thursday, May 11, 2023. |
As Sluggish Stocks Are Stirred by Oil Fears, I'm Sticking With This NameHere's why I'm still eyeing my stock of the week pick, as rotational action is dominating the market on Monday. |
Innodata (NASDAQ:INOD) Is In A Good Position To Deliver On Growth PlansWe can readily understand why investors are attracted to unprofitable companies. For example, although... |
INOD Price Returns
1-mo | 70.69% |
3-mo | 67.16% |
6-mo | 263.34% |
1-year | 79.37% |
3-year | 730.88% |
5-year | 849.58% |
YTD | 281.11% |
2022 | -49.92% |
2021 | 11.70% |
2020 | 364.91% |
2019 | -24.00% |
2018 | 10.29% |
Continue Researching INOD
Want to do more research on Innodata Inc's stock and its price? Try the links below:Innodata Inc (INOD) Stock Price | Nasdaq
Innodata Inc (INOD) Stock Quote, History and News - Yahoo Finance
Innodata Inc (INOD) Stock Price and Basic Information | MarketWatch
Loading social stream, please wait...