Insmed, Inc. (INSM): Price and Financial Metrics
INSM Price/Volume Stats
Current price | $27.96 | 52-week high | $28.32 |
Prev. close | $27.57 | 52-week low | $16.04 |
Day low | $27.45 | Volume | 1,881,900 |
Day high | $28.20 | Avg. volume | 1,254,755 |
50-day MA | $24.94 | Dividend yield | N/A |
200-day MA | $21.57 | Market Cap | 4.00B |
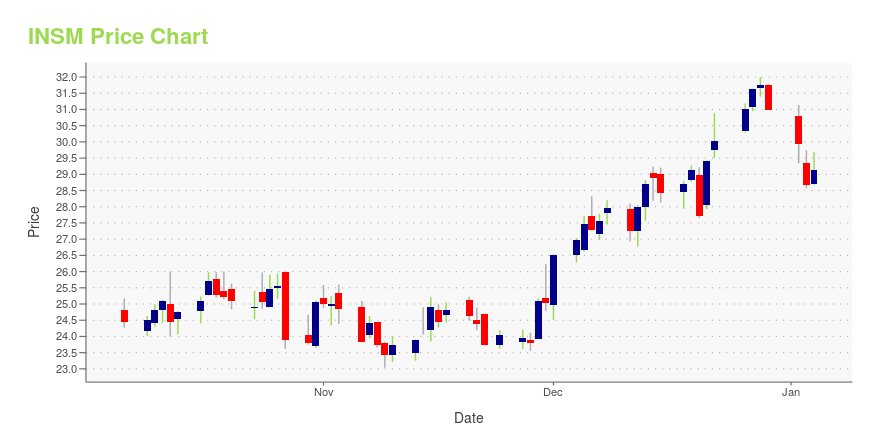
INSM Stock Price Chart Interactive Chart >
INSM POWR Grades
- INSM scores best on the Value dimension, with a Value rank ahead of 60.28% of US stocks.
- INSM's strongest trending metric is Quality; it's been moving down over the last 177 days.
- INSM ranks lowest in Momentum; there it ranks in the 4th percentile.
INSM Stock Summary
- INSMED INC's capital turnover -- a measure of revenue relative to shareholder's equity -- is better than just 5.45% of US listed stocks.
- With a price/sales ratio of 13.51, INSMED INC has a higher such ratio than 92.18% of stocks in our set.
- INSM's equity multiplier -- a measure of assets relative to shareholders'equity -- is greater than that of merely 1.73% of US stocks.
- If you're looking for stocks that are quantitatively similar to INSMED INC, a group of peers worth examining would be CYTK, FGEN, APLT, NVAX, and CPTN.
- INSM's SEC filings can be seen here. And to visit INSMED INC's official web site, go to www.insmed.com.
INSM Valuation Summary
- In comparison to the median Healthcare stock, INSM's price/earnings ratio is 118.46% lower, now standing at -4.9.
- Over the past 243 months, INSM's price/sales ratio has gone down 737.2.
Below are key valuation metrics over time for INSM.
Stock | Date | P/S | P/B | P/E | EV/EBIT |
---|---|---|---|---|---|
INSM | 2023-11-20 | 12.5 | -12.2 | -4.9 | -6.8 |
INSM | 2023-11-17 | 12.6 | -12.3 | -4.9 | -6.8 |
INSM | 2023-11-16 | 12.5 | -12.1 | -4.8 | -6.8 |
INSM | 2023-11-15 | 12.7 | -12.3 | -4.9 | -6.9 |
INSM | 2023-11-14 | 12.5 | -12.1 | -4.9 | -6.8 |
INSM | 2023-11-13 | 12.2 | -11.8 | -4.7 | -6.6 |
INSM Growth Metrics
- Its 4 year cash and equivalents growth rate is now at 240.87%.
- Its 2 year cash and equivalents growth rate is now at 20.23%.
- Its year over year cash and equivalents growth rate is now at 25.86%.

The table below shows INSM's growth in key financial areas (numbers in millions of US dollars).
Date | Revenue | Operating Cash Flow | Net Income to Common Stock |
---|---|---|---|
2022-12-31 | 245.358 | -400.439 | -481.534 |
2022-09-30 | 242.182 | -381.422 | -434.389 |
2022-06-30 | 221.209 | -367.039 | -415.958 |
2022-03-31 | 201.354 | -340.182 | -437.634 |
2021-12-31 | 188.461 | -363.302 | -434.654 |
2021-09-30 | 173.752 | -345.962 | -423.889 |
INSM's Quality Factors
The “Quality” component of the POWR Ratings focuses on 31 different factors of a companies fundamentals and operational strength. Here are some key insights as we drill into the specifics of these quality attributes.- INSM has a Quality Grade of C, ranking ahead of 31.6% of graded US stocks.
- INSM's asset turnover comes in at 0.172 -- ranking 207th of 682 Pharmaceutical Products stocks.
- CYRX, CTLT, and ACOR are the stocks whose asset turnover ratios are most correlated with INSM.
The table below shows INSM's key quality metrics over time.
Period | Asset Turnover | Gross Margin | ROIC |
---|---|---|---|
2021-09-30 | 0.172 | 0.760 | -0.609 |
2021-06-30 | 0.192 | 0.753 | -0.585 |
2021-03-31 | 0.209 | 0.754 | -0.551 |
2020-12-31 | 0.206 | 0.757 | -0.513 |
2020-09-30 | 0.215 | 0.776 | -0.415 |
2020-06-30 | 0.214 | 0.795 | -0.422 |
INSM Price Target
For more insight on analysts targets of INSM, see our INSM price target page. And for a list of of all stocks sorted by upside potential based on analyst target price, see our Top Price Target page.
Average Price Target | $51.78 | Average Broker Recommendation | 1.4 (Strong Buy) |
Insmed, Inc. (INSM) Company Bio
Insmed Incorporated is a biopharmaceutical company focused on developing targeted inhaled therapies for patients suffering from rare lung diseases. The company was founded in 1999 and is based in Bridgewater, New Jersey.
Latest INSM News From Around the Web
Below are the latest news stories about INSMED INC that investors may wish to consider to help them evaluate INSM as an investment opportunity.
Insmed To Present at the Nasdaq 49th Investor ConferenceInsmed Incorporated (Nasdaq: INSM), a global biopharmaceutical company on a mission to transform the lives of patients with serious and rare diseases, today announced that management will present at the Nasdaq 49th Investor Conference in London on Wednesday, December 6, 2023, at 8:30 a.m. ET/1:30 p.m. GMT. |
Vanguard Group Inc Adds Shares in Insmed IncVanguard Group Inc, a prominent investment firm, has recently expanded its portfolio by acquiring additional shares in Insmed Inc (NASDAQ:INSM). On October 31, 2023, Vanguard Group Inc reported an addition of 1,089,800 shares in Insmed Inc, reflecting an 8.18% change in their holdings. The transaction was executed at a price of $25.06 per share, increasing Vanguard's total share count in Insmed to 14,410,356. |
Insmed To Present at Two November ConferencesInsmed Incorporated (Nasdaq:INSM), a global biopharmaceutical company on a mission to transform the lives of patients with serious and rare diseases, today announced that management will present at the following investor conferences: |
Insmed Reports Inducement Grants Under NASDAQ Listing Rule 5635(c)(4)Insmed Incorporated (Nasdaq: INSM), a global biopharmaceutical company on a mission to transform the lives of patients with serious and rare diseases, today announced the granting of inducement awards to 21 new employees. In accordance with NASDAQ Listing Rule 5635(c)(4), the awards were approved by Insmed's Compensation Committee and made as a material inducement to each employee's entry into employment with the Company. |
Insmed Holds Second Annual Global Day of Good to Benefit Communities Across the GlobeInsmed Incorporated (Nasdaq:INSM), a global biopharmaceutical company on a mission to transform the lives of patients with serious and rare diseases, today holds its second annual Global Day of Good, with hundreds of Insmed employees volunteering simultaneously in their respective communities. |
INSM Price Returns
1-mo | 17.73% |
3-mo | 6.47% |
6-mo | 41.21% |
1-year | 50.08% |
3-year | -28.95% |
5-year | 77.41% |
YTD | 39.94% |
2022 | -26.65% |
2021 | -18.17% |
2020 | 39.41% |
2019 | 82.01% |
2018 | -57.92% |
Continue Researching INSM
Want to do more research on INSMED Inc's stock and its price? Try the links below:INSMED Inc (INSM) Stock Price | Nasdaq
INSMED Inc (INSM) Stock Quote, History and News - Yahoo Finance
INSMED Inc (INSM) Stock Price and Basic Information | MarketWatch
Loading social stream, please wait...