Intuit Inc. (INTU): Price and Financial Metrics
GET POWR RATINGS... FREE!
INTU POWR Grades
- Quality is the dimension where INTU ranks best; there it ranks ahead of 85.1% of US stocks.
- The strongest trend for INTU is in Growth, which has been heading up over the past 179 days.
- INTU ranks lowest in Momentum; there it ranks in the 28th percentile.
INTU Stock Summary
- INTU has a higher market value than 98.25% of US stocks; more precisely, its current market capitalization is $137,265,862,866.
- With a one year PEG ratio of 280.73, Intuit Inc is expected to have a higher PEG ratio (a measure of how expensive a stock is relative to its expected earnings growth) than 90.93% of US stocks.
- With a year-over-year growth in debt of 160.5%, Intuit Inc's debt growth rate surpasses 93.2% of about US stocks.
- Stocks that are quantitatively similar to INTU, based on their financial statements, market capitalization, and price volatility, are PYPL, SAP, SHOP, ABNB, and ISRG.
- Visit INTU's SEC page to see the company's official filings. To visit the company's web site, go to www.intuit.com.
INTU Valuation Summary
- INTU's EV/EBIT ratio is 57.4; this is 77.98% higher than that of the median Technology stock.
- INTU's price/earnings ratio has moved up 1758.3 over the prior 243 months.
- Over the past 243 months, INTU's EV/EBIT ratio has gone down 89.1.
Below are key valuation metrics over time for INTU.
Stock | Date | P/S | P/B | P/E | EV/EBIT |
---|---|---|---|---|---|
INTU | 2021-09-01 | 17.3 | 15.5 | 72.3 | 57.4 |
INTU | 2021-08-31 | 17.4 | 15.5 | 72.7 | 57.7 |
INTU | 2021-08-30 | 17.4 | 15.5 | 72.7 | 57.6 |
INTU | 2021-08-27 | 17.4 | 15.5 | 72.7 | 57.7 |
INTU | 2021-08-26 | 17.0 | 15.2 | 71.0 | 56.3 |
INTU | 2021-08-25 | 17.1 | 15.3 | 71.4 | 56.6 |
INTU Growth Metrics
- Its 2 year price growth rate is now at 52.2%.
- The 5 year price growth rate now stands at 170.25%.
- Its 3 year net cashflow from operations growth rate is now at 61.35%.

The table below shows INTU's growth in key financial areas (numbers in millions of US dollars).
Date | Revenue | Operating Cash Flow | Net Income to Common Stock |
---|---|---|---|
2021-12-31 | 11,414 | 3,156 | 2,172 |
2021-09-30 | 10,317 | 3,350 | 2,092 |
2021-06-30 | 9,633 | 3,250 | 2,062 |
2021-03-31 | 8,888 | 2,995 | 2,127 |
2020-12-31 | 7,717 | 2,548 | 1,747 |
2020-09-30 | 7,837 | 2,586 | 1,967 |
INTU's Quality Factors
The “Quality” component of the POWR Ratings focuses on 31 different factors of a companies fundamentals and operational strength. Here are some key insights as we drill into the specifics of these quality attributes.- INTU has a Quality Grade of A, ranking ahead of 98.18% of graded US stocks.
- INTU's asset turnover comes in at 0.693 -- ranking 225th of 561 Business Services stocks.
- HPTO, GRPN, and VVI are the stocks whose asset turnover ratios are most correlated with INTU.
The table below shows INTU's key quality metrics over time.
Period | Asset Turnover | Gross Margin | ROIC |
---|---|---|---|
2021-07-31 | 0.693 | 0.830 | 0.732 |
2021-04-30 | 0.697 | 0.831 | 0.811 |
2021-01-31 | 0.718 | 0.826 | 0.826 |
2020-10-31 | 0.893 | 0.831 | 1.127 |
2020-07-31 | 0.973 | 0.823 | 1.239 |
2020-04-30 | 1.018 | 0.808 | 1.219 |
INTU Price Target
For more insight on analysts targets of INTU, see our INTU price target page. And for a list of of all stocks sorted by upside potential based on analyst target price, see our Top Price Target page.
Average Price Target | $608.02 | Average Broker Recommendation | 1.41 (Moderate Buy) |
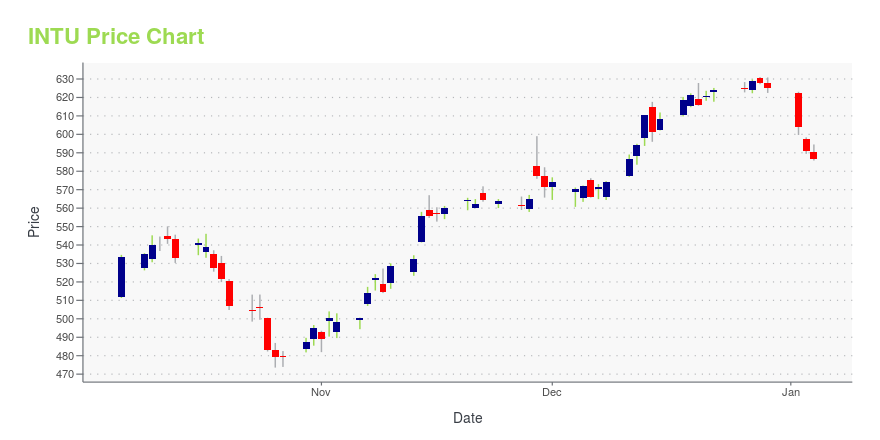
INTU Stock Price Chart Interactive Chart >
INTU Price/Volume Stats
Current price | $358.97 | 52-week high | $716.86 |
Prev. close | $371.37 | 52-week low | $339.36 |
Day low | $355.74 | Volume | 2,851,286 |
Day high | $365.71 | Avg. volume | 1,947,437 |
50-day MA | $437.89 | Dividend yield | 0.73% |
200-day MA | $538.05 | Market Cap | 101.52B |
Intuit Inc. (INTU) Company Bio
Intuit Inc. is an American business that specializes in financial software. The company is headquartered in Mountain View, California, and the CEO is Sasan Goodarzi. As of 2019, more than 95% of its revenues and earnings come from its activities within the United States. Intuit's products include the tax preparation application TurboTax, personal finance app Mint and the small business accounting program QuickBooks. Intuit has lobbied extensively against the IRS providing taxpayers with free pre-filled forms, as is the norm in other developed countries. (Source:Wikipedia)
Latest INTU News From Around the Web
Below are the latest news stories about Intuit Inc that investors may wish to consider to help them evaluate INTU as an investment opportunity.
Intuit Inc. (INTU) CEO Sasan Goodarzi on Q2 2022 Results - Earnings Call TranscriptIntuit Inc. (INTU) Q2 2022 Earnings Conference Call February 24, 2022 4:30 PM ET Company Participants Kim Watkins - IR Sasan Goodarzi - CEO Michelle Clatterbuck - CFO Conference Call Participants Scott Schneeberger - Oppenheimer Sterling Auty - JPMorgan Kash Rangan - Goldman Sachs Sitikantha Panigrahi - Mizuho Securities Keith... |
Intuit Q2 Earnings and Revenues Miss Estimates; Issues GuidanceIntuit (INTU) delivered disappointing Fiscal Q2 2022 results. The company also issued full-year EPS guidance that missed estimates. INTU shares rose 6.45% to close at $497.13 on February 24. Intuit is a software company that offers financial management solutions and compliance products and services. Earnings Revenue in the quarter was up 70% year-over-year to $2.7 billion but fell short of consensus estimates of $2.74 billion. The increase was driven by a 47% increase in small business and self-employed group revenue to $1.6 billion. Online ecosystem revenue was also up 74% year-over-year to $1.1 billion as Credit Karma revenue landed at $444 million. |
Intuit Stock Falls As TurboTax Maker Impacted By Slow Start To Tax SeasonFinancial software firm Intuit late Thursday missed Wall Street's estimates for its fiscal second quarter. Intuit stock fell. |
Intuit (INTU) Q2 Earnings Miss, Revenues Beat, Stock DownIntuit's (INTU) Q2 results reflect the strong improvement in the do-it-yourself category, solid customer growth and robust revenues from the newly acquired Credit Karma and Mailchimp businesses. |
Intuit Shares Slide Following Earnings, Revenue MissBy Sam Boughedda |
INTU Price Returns
1-mo | -19.02% |
3-mo | -23.03% |
6-mo | N/A |
1-year | -17.98% |
3-year | 42.57% |
5-year | 170.18% |
YTD | -44.05% |
2021 | 70.48% |
2020 | 46.38% |
2019 | 34.11% |
2018 | 25.86% |
2017 | 39.21% |
INTU Dividends
Ex-Dividend Date | Type | Payout Amount | Change | ||||||
---|---|---|---|---|---|---|---|---|---|
Loading, please wait... |
Continue Researching INTU
Here are a few links from around the web to help you further your research on Intuit Inc's stock as an investment opportunity:Intuit Inc (INTU) Stock Price | Nasdaq
Intuit Inc (INTU) Stock Quote, History and News - Yahoo Finance
Intuit Inc (INTU) Stock Price and Basic Information | MarketWatch
Loading social stream, please wait...