
Innoviva, Inc. (INVA): Price and Financial Metrics
INVA Price/Volume Stats
| Current price | $18.55 | 52-week high | $18.70 |
| Prev. close | $18.19 | 52-week low | $12.22 |
| Day low | $18.28 | Volume | 500,720 |
| Day high | $18.70 | Avg. volume | 613,944 |
| 50-day MA | $16.39 | Dividend yield | N/A |
| 200-day MA | $15.31 | Market Cap | 1.16B |
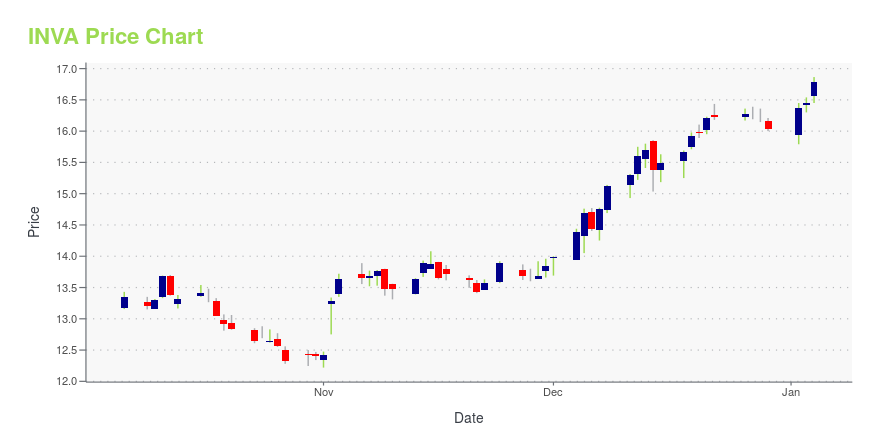
INVA Stock Price Chart Interactive Chart >
Innoviva, Inc. (INVA) Company Bio
Innoviva is a biopharmaceutical company. The Company develops small molecule medicines for respiratory disease, bacterial infections, and gastrointestinal disorders. The company was founded in 1996 and is based in South San Francisco, California.
Latest INVA News From Around the Web
Below are the latest news stories about INNOVIVA INC that investors may wish to consider to help them evaluate INVA as an investment opportunity.
Insider Sell Alert: Marianne Zhen Offloads Shares of Innoviva IncIn the realm of stock market movements, insider trading activity is often a significant indicator that investors keep a close eye on. |
Innoviva, Inc. (NASDAQ:INVA) Has Fared Decently But Fundamentals Look Uncertain: What Lies Ahead For The Stock?Most readers would already know that Innoviva's (NASDAQ:INVA) stock increased by 2.5% over the past month. However, the... |
Innoviva Inc (INVA) Reports Q3 2023 Financial Results: Net Income Drops to $82.0 MillionDespite a decrease in net income, the company shows promise with the launch of new therapy and positive Phase 3 data |
Innoviva Reports Third Quarter 2023 Financial Results and Highlights Recent Company ProgressBURLINGAME, Calif., November 01, 2023--Innoviva, Inc. (NASDAQ: INVA) ("Innoviva" or the "Company"), a diversified holding company with a portfolio of royalties and other healthcare assets, today reported financial results for the third quarter ended September 30, 2023, highlighted select corporate achievements and provided an overview of its key business initiatives. |
Positive Results Announced in Largest Pivotal Phase 3 Trial of a First-in-Class Oral Antibiotic to Treat Uncomplicated GonorrheaGENEVA & WALTHAM, Mass., November 01, 2023--The Global Antibiotic Research & Development Partnership (GARDP), in collaboration with Innoviva Specialty Therapeutics, a subsidiary of Innoviva, Inc. (Nasdaq: INVA), announced today that zoliflodacin, a first-in-class antibiotic, met its primary endpoint in an unprecedented global pivotal Phase 3 clinical trial. Study investigators found that oral zoliflodacin demonstrated statistical non-inferiority of microbiological cure at the urogenital site whe |
INVA Price Returns
| 1-mo | 13.94% |
| 3-mo | 21.56% |
| 6-mo | 12.77% |
| 1-year | 42.91% |
| 3-year | 39.89% |
| 5-year | 61.73% |
| YTD | 15.65% |
| 2023 | 21.06% |
| 2022 | -23.19% |
| 2021 | 39.23% |
| 2020 | -12.50% |
| 2019 | -18.85% |
Continue Researching INVA
Want to do more research on Innoviva Inc's stock and its price? Try the links below:Innoviva Inc (INVA) Stock Price | Nasdaq
Innoviva Inc (INVA) Stock Quote, History and News - Yahoo Finance
Innoviva Inc (INVA) Stock Price and Basic Information | MarketWatch
Loading social stream, please wait...