Invitation Homes Inc. (INVH): Price and Financial Metrics
INVH Price/Volume Stats
Current price | $34.50 | 52-week high | $36.53 |
Prev. close | $34.62 | 52-week low | $28.49 |
Day low | $34.50 | Volume | 2,254 |
Day high | $34.50 | Avg. volume | 3,284,495 |
50-day MA | $33.68 | Dividend yield | 3.21% |
200-day MA | $33.59 | Market Cap | 21.11B |
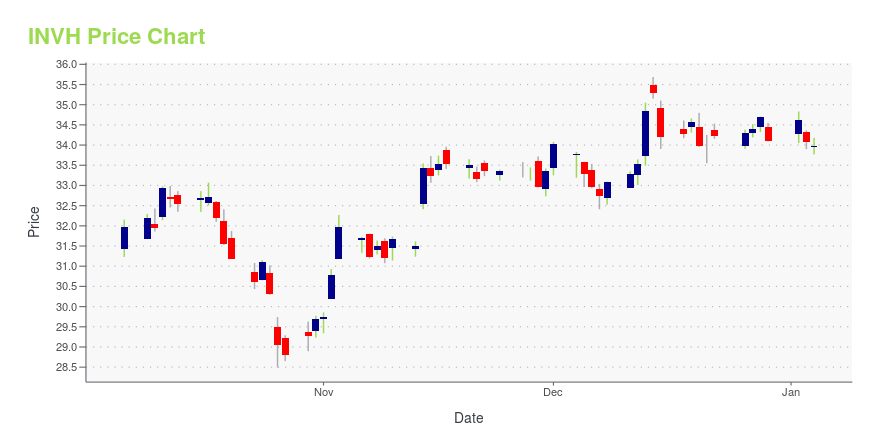
INVH Stock Price Chart Interactive Chart >
INVH POWR Grades
- INVH scores best on the Sentiment dimension, with a Sentiment rank ahead of 81.1% of US stocks.
- INVH's strongest trending metric is Value; it's been moving up over the last 26 weeks.
- INVH's current lowest rank is in the Value metric (where it is better than 16.79% of US stocks).
INVH Stock Summary
- Of note is the ratio of INVITATION HOMES INC's sales and general administrative expense to its total operating expenses; only 4.44% of US stocks have a lower such ratio.
- For INVH, its debt to operating expenses ratio is greater than that reported by 95.08% of US equities we're observing.
- The volatility of INVITATION HOMES INC's share price is greater than that of merely 2.78% US stocks with at least 200 days of trading history.
- Stocks with similar financial metrics, market capitalization, and price volatility to INVITATION HOMES INC are ESS, FRT, BXP, WPC, and ADC.
- Visit INVH's SEC page to see the company's official filings. To visit the company's web site, go to www.InvitationHomes.com.
INVH Valuation Summary
- INVH's EV/EBIT ratio is 35; this is 18.24% higher than that of the median Real Estate stock.
- Over the past 84 months, INVH's price/sales ratio has gone up 1.5.
Below are key valuation metrics over time for INVH.
Stock | Date | P/S | P/B | P/E | EV/EBIT |
---|---|---|---|---|---|
INVH | 2023-12-29 | 8.7 | 2.0 | 42.6 | 35.0 |
INVH | 2023-12-28 | 8.9 | 2.1 | 43.3 | 35.5 |
INVH | 2023-12-27 | 8.8 | 2.1 | 42.9 | 35.2 |
INVH | 2023-12-26 | 8.8 | 2.1 | 42.8 | 35.1 |
INVH | 2023-12-22 | 8.8 | 2.0 | 42.7 | 35.1 |
INVH | 2023-12-21 | 8.8 | 2.0 | 42.7 | 35.1 |
INVH Growth Metrics
- Its 3 year revenue growth rate is now at 18.38%.
- Its 5 year revenue growth rate is now at 92.82%.
- The 5 year cash and equivalents growth rate now stands at 22.75%.
The table below shows INVH's growth in key financial areas (numbers in millions of US dollars).
Date | Revenue | Operating Cash Flow | Net Income to Common Stock |
---|---|---|---|
2022-09-30 | 2,178.51 | 1,029.292 | 357.3 |
2022-06-30 | 2,119.367 | 989.616 | 347.298 |
2022-03-31 | 2,053.7 | 902.106 | 296.673 |
2021-12-31 | 1,996.615 | 907.66 | 261.425 |
2021-09-30 | 1,940.49 | 853.354 | 257.581 |
2021-06-30 | 1,890.142 | 770.878 | 221.058 |
INVH's Quality Factors
The “Quality” component of the POWR Ratings focuses on 31 different factors of a companies fundamentals and operational strength. Here are some key insights as we drill into the specifics of these quality attributes.- INVH has a Quality Grade of D, ranking ahead of 10.59% of graded US stocks.
- INVH's asset turnover comes in at 0.11 -- ranking 38th of 63 Real Estate stocks.
- NOVC, KW, and VAC are the stocks whose asset turnover ratios are most correlated with INVH.
The table below shows INVH's key quality metrics over time.
Period | Asset Turnover | Gross Margin | ROIC |
---|---|---|---|
2021-09-30 | 0.110 | 0.607 | 0.024 |
2021-06-30 | 0.108 | 0.601 | 0.023 |
2021-03-31 | 0.105 | 0.598 | 0.022 |
2020-12-31 | 0.103 | 0.595 | 0.022 |
2020-09-30 | 0.102 | 0.591 | 0.021 |
2020-06-30 | 0.102 | 0.588 | 0.021 |
Invitation Homes Inc. (INVH) Company Bio
Invitation Homes Inc. is a public company traded on the New York Stock Exchange. It is headquartered in the Comerica Bank Tower in Dallas, Texas. Dallas B. Tanner serves as chief executive officer. As of 2017, the company was reportedly the largest owner of single-family rental homes in the United States. As of September 2020, the company owned about 80,000 rental homes in 16 markets. (Source:Wikipedia)
Latest INVH News From Around the Web
Below are the latest news stories about INVITATION HOMES INC that investors may wish to consider to help them evaluate INVH as an investment opportunity.
2 Residential REITs With Yields up to 4.1%The U.S. real estate market is more unaffordable than ever before, pushing more people to rent versus buy and making residential real estate investment trusts (REITs) very interesting for investors. Residential REITs offer investors the benefits of owning rental properties without the hassles of purchasing a property or being a landlord. They also carry the benefit of being liquid, since you can sell a stock any time the market is open, compared with a property that could take months or years to |
Invitation Homes Inc's Dividend AnalysisInvitation Homes Inc (NYSE:INVH) recently announced a dividend of $0.28 per share, payable on 2024-01-19, with the ex-dividend date set for 2023-12-26. As investors look forward to this upcoming payment, the spotlight also shines on the company's dividend history, yield, and growth rates. Using the data from GuruFocus, let's delve into Invitation Homes Inc's dividend performance and evaluate its sustainability. |
3 Super-Easy Ways to Start Earning Real Estate Passive Income in 2024 With Less Than $100REITs make it really easy to start generating passive income from real estate. |
If You Invested $10,000 In Invitation Homes Five Years Ago, Here's How Much In Dividends You Would Have NowWhen considering buying dividend stocks, total return is not just about the price today versus the price an investor originally paid for the shares. Total return includes share price appreciation plus the dividends received, and the return may differ, depending on whether the investor collects or reinvests the dividends. The dividends a company pays can vary over time. Many investors focus on the present dividend yield, but the dividend growth record over several years is equally important. Take |
3 Ways Millennials Can Profit From Their Housing WoesMillennial housing trends aren’t good. |
INVH Price Returns
1-mo | 5.50% |
3-mo | 2.40% |
6-mo | 6.24% |
1-year | 16.31% |
3-year | 21.70% |
5-year | 62.70% |
YTD | 1.14% |
2023 | 19.71% |
2022 | -33.04% |
2021 | 55.58% |
2020 | 1.19% |
2019 | 52.27% |
INVH Dividends
Ex-Dividend Date | Type | Payout Amount | Change | ||||||
---|---|---|---|---|---|---|---|---|---|
Loading, please wait... |
Continue Researching INVH
Want to do more research on Invitation Homes Inc's stock and its price? Try the links below:Invitation Homes Inc (INVH) Stock Price | Nasdaq
Invitation Homes Inc (INVH) Stock Quote, History and News - Yahoo Finance
Invitation Homes Inc (INVH) Stock Price and Basic Information | MarketWatch
Loading social stream, please wait...