
Ionis Pharmaceuticals, Inc. (IONS): Price and Financial Metrics
IONS Price/Volume Stats
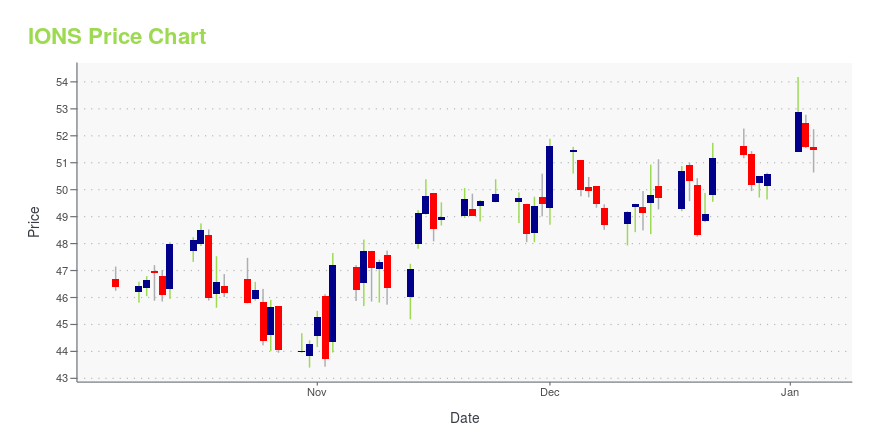
| Current price | $51.45 | 52-week high | $54.44 |
| Prev. close | $51.86 | 52-week low | $35.95 |
| Day low | $51.04 | Volume | 766,354 |
| Day high | $52.34 | Avg. volume | 1,221,320 |
| 50-day MA | $43.35 | Dividend yield | N/A |
| 200-day MA | $45.78 | Market Cap | 7.51B |
IONS Stock Price Chart Interactive Chart >
Ionis Pharmaceuticals, Inc. (IONS) Company Bio
Ionis Pharmaceuticals, Inc., a RNA-targeted drug discovery and development company, focuses on developing drugs for patients with severe and rare diseases. The company was formerly known as Isis Pharmaceuticals, Inc. and changed its name to Ionis Pharmaceuticals, Inc. in December 2015. Ionis Pharmaceuticals, Inc. was founded in 1989 and is based in Carlsbad, California.
Latest IONS News From Around the Web
Below are the latest news stories about IONIS PHARMACEUTICALS INC that investors may wish to consider to help them evaluate IONS as an investment opportunity.
3 Stocks to Buy Now Before They Become Tomorrow’s Trillion-Dollar CompaniesThese future trillion dollar stocks can solidify portfolio growth for long-term investors. |
Ionis Pharmaceuticals Inc EVP, Chief Scientific Officer C Bennett Sells 22,613 SharesIonis Pharmaceuticals Inc (NASDAQ:IONS), a leader in RNA-targeted drug discovery and development, has experienced a recent insider sell according to a SEC Filing. |
WAINUA™ (eplontersen) granted regulatory approval in the U.S. for the treatment of adults with polyneuropathy of hereditary transthyretin-mediated amyloidosisIonis Pharmaceuticals, Inc. (Nasdaq: IONS) announced today that the U.S. Food and Drug Administration (FDA) has approved Ionis and AstraZeneca's WAINUA™ (eplontersen) for the treatment of the polyneuropathy of hereditary transthyretin-mediated amyloidosis in adults, commonly referred to as hATTR-PN or ATTRv-PN. WAINUA is the only approved medicine for the treatment of ATTRv-PN that can be self-administered via an auto-injector. |
CORRECTED-UPDATE 2-US FDA approves Ionis-AstraZeneca's nerve disease drugThe U.S. Food and Drug Administration (FDA) on Thursday approved Ionis Pharmaceuticals and partner AstraZeneca's drug to treat nerve damage caused by a life-shortening rare disease. The drug, branded as Wainua, is approved for patients with polyneuropathy, or nerve damage caused by hereditary transthyretin amyloidosis (ATTR-PN), which affects an estimated 40,000 patients globally. Transthyretin amyloidosis is a progressive condition characterized by the build-up of abnormal protein deposits in the body's organs and tissues. |
12 Most Promising Gene Editing Stocks According to Hedge FundsIn this piece, we will take a look at the 12 most promising gene editing stocks according to hedge funds. If you want to skip our take on how the gene editing industry sits right at the top of the global innovation food chain, then you can take a look at the 5 Most Promising […] |
IONS Price Returns
| 1-mo | 7.86% |
| 3-mo | 23.71% |
| 6-mo | -0.08% |
| 1-year | 33.64% |
| 3-year | 41.46% |
| 5-year | -19.52% |
| YTD | 1.70% |
| 2023 | 33.94% |
| 2022 | 24.12% |
| 2021 | -46.18% |
| 2020 | -6.41% |
| 2019 | 11.75% |
Continue Researching IONS
Want to see what other sources are saying about Ionis Pharmaceuticals Inc's financials and stock price? Try the links below:Ionis Pharmaceuticals Inc (IONS) Stock Price | Nasdaq
Ionis Pharmaceuticals Inc (IONS) Stock Quote, History and News - Yahoo Finance
Ionis Pharmaceuticals Inc (IONS) Stock Price and Basic Information | MarketWatch
Loading social stream, please wait...