Iovance Biotherapeutics, Inc. (IOVA): Price and Financial Metrics
IOVA Price/Volume Stats
Current price | $14.03 | 52-week high | $18.33 |
Prev. close | $13.91 | 52-week low | $3.21 |
Day low | $13.60 | Volume | 6,693,100 |
Day high | $14.65 | Avg. volume | 10,486,419 |
50-day MA | $11.38 | Dividend yield | N/A |
200-day MA | $7.52 | Market Cap | 3.92B |
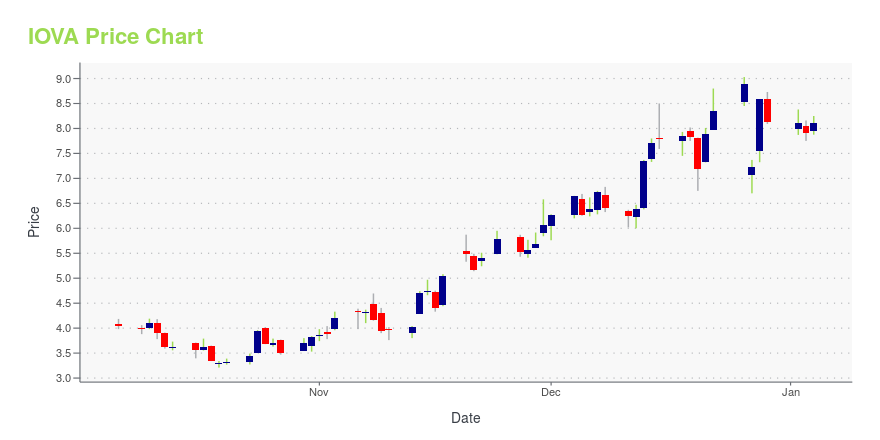
IOVA Stock Price Chart Interactive Chart >
IOVA POWR Grades
- IOVA scores best on the Growth dimension, with a Growth rank ahead of 53.66% of US stocks.
- IOVA's strongest trending metric is Quality; it's been moving down over the last 26 weeks.
- IOVA ranks lowest in Stability; there it ranks in the 2nd percentile.
IOVA Stock Summary
- The capital turnover (annual revenue relative to shareholder's equity) for IOVA is 0 -- better than just 8.17% of US stocks.
- With a price/sales ratio of 2,859.63, IOVANCE BIOTHERAPEUTICS INC has a higher such ratio than 99.7% of stocks in our set.
- Revenue growth over the past 12 months for IOVANCE BIOTHERAPEUTICS INC comes in at 197.06%, a number that bests 97.34% of the US stocks we're tracking.
- If you're looking for stocks that are quantitatively similar to IOVANCE BIOTHERAPEUTICS INC, a group of peers worth examining would be ALLO, ALT, CLDX, ENTA, and ANAB.
- IOVA's SEC filings can be seen here. And to visit IOVANCE BIOTHERAPEUTICS INC's official web site, go to www.iovance.com.
IOVA Valuation Summary
- IOVA's price/sales ratio is 2942.9; this is 133668.18% higher than that of the median Healthcare stock.
- IOVA's price/sales ratio has moved NA NA over the prior 161 months.
Below are key valuation metrics over time for IOVA.
Stock | Date | P/S | P/B | P/E | EV/EBIT |
---|---|---|---|---|---|
IOVA | 2023-12-29 | 2942.9 | 3.1 | -4.8 | -4.2 |
IOVA | 2023-12-28 | 3105.8 | 3.3 | -5.1 | -4.5 |
IOVA | 2023-12-27 | 2617.1 | 2.7 | -4.3 | -3.7 |
IOVA | 2023-12-26 | 3218.0 | 3.4 | -5.3 | -4.6 |
IOVA | 2023-12-22 | 3019.0 | 3.2 | -4.9 | -4.3 |
IOVA | 2023-12-21 | 2856.0 | 3.0 | -4.7 | -4.1 |
IOVA Growth Metrics
- Its 4 year price growth rate is now at 444.33%.
- Its 4 year net cashflow from operations growth rate is now at -315.8%.
- Its 5 year net income to common stockholders growth rate is now at -98.2%.
The table below shows IOVA's growth in key financial areas (numbers in millions of US dollars).
Date | Revenue | Operating Cash Flow | Net Income to Common Stock |
---|---|---|---|
2022-09-30 | 0 | -268.935 | -389.904 |
2022-06-30 | 0 | -262.979 | -376.408 |
2022-03-31 | 0 | -239.352 | -358.41 |
2021-12-31 | 0 | -227.941 | -342.252 |
2021-09-30 | 0 | -236.784 | -311.319 |
2021-06-30 | 0 | -219.606 | -283.768 |
IOVA's Quality Factors
The “Quality” component of the POWR Ratings focuses on 31 different factors of a companies fundamentals and operational strength. Here are some key insights as we drill into the specifics of these quality attributes.- IOVA has a Quality Grade of D, ranking ahead of 7.09% of graded US stocks.
- IOVA's asset turnover comes in at 0 -- ranking 441st of 682 Pharmaceutical Products stocks.
- PPBT, TEVA, and PTE are the stocks whose asset turnover ratios are most correlated with IOVA.
The table below shows IOVA's key quality metrics over time.
Period | Asset Turnover | Gross Margin | ROIC |
---|---|---|---|
2021-06-30 | 0 | NA | -0.418 |
2021-03-31 | 0 | NA | -0.414 |
2020-12-31 | 0 | NA | -0.482 |
2020-09-30 | 0 | NA | -0.580 |
2020-06-30 | 0 | NA | -0.686 |
2020-03-31 | 0 | NA | -0.793 |
IOVA Price Target
For more insight on analysts targets of IOVA, see our IOVA price target page. And for a list of of all stocks sorted by upside potential based on analyst target price, see our Top Price Target page.
Average Price Target | $40.31 | Average Broker Recommendation | 1.5 (Moderate Buy) |
Iovance Biotherapeutics, Inc. (IOVA) Company Bio
Iovance Biotherapeutics, formerly known as Lion Biotechnologies, Inc. is a clinical-stage biopharmaceutical company focused on developing and commercializing cancer immunotherapy products to harness the power of a patient's immune system to eradicate cancer cells. The company was founded in 2007 and is based in Woodland Hills, California.
Latest IOVA News From Around the Web
Below are the latest news stories about IOVANCE BIOTHERAPEUTICS INC that investors may wish to consider to help them evaluate IOVA as an investment opportunity.
Why Iovance Biotherapeutics Stock Popped TodayIovance rebounded nicely after yesterday's drop, which came after the FDA put a clinical hold on its cancer-therapy trial. |
Iovance (IOVA) Falls After Clinical Update on Lung Cancer DrugIovance (IOVA) is likely to pause enrollment in the phase II IOV-LUN-202 study evaluating its tumor infiltrating lymphocyte therapy, LN-145, for treating non-small cell lung cancer. Stock declines. |
3 Charts For Investors to Watch Thursday: GC Education, Iovance, EthereumThese two stocks and one cryptocurrency are worth watching today. We discuss why and identify important chart levels to watch. |
Gold nears $2100, biotech stocks on the move: Trending tickersGold (GC=F) prices are inching closer to $2,100 per ounce. It's an area that has been a bit of a resistance level for the precious metal. In the world of biotech, Cytokinetics (CYTK) shares soared more than 80% after a trial for its hear drug showed promising results. Meanwhile, Iovance Biotherapeutics (IOVA) shares fell 18% after the Food and Drug Administration paused clinical trials of a lung cancer treatment following the death of a patient. For more expert insight and the latest market action, click here to watch this full episode of Yahoo Finance Live. |
FDA Slaps Clinical Hold On Iovance Biotherapeutics' Lung Cancer Study After Patient DeathWednesday, Iovance Biotherapeutics Inc (NASDAQ: IOVA) announced a clinical program update for LN-145 TIL therapy in non-small lung cancer (NSCLC). The FDA placed a clinical hold on the IOV-LUN-202 trial on December 22, 2023, in response to a recently reported Grade 5 (fatal) serious adverse event potentially related to the non-myeloablative lymphodepletion pre-conditioning regimen. During the clinical hold, Iovance will pause enrollment and the LN-145 TIL treatment regimen for new patients in IO |
IOVA Price Returns
1-mo | 53.33% |
3-mo | 79.41% |
6-mo | 167.24% |
1-year | 117.18% |
3-year | -55.26% |
5-year | 40.02% |
YTD | 72.57% |
2023 | 27.23% |
2022 | -66.53% |
2021 | -58.86% |
2020 | 67.63% |
2019 | 212.77% |
Loading social stream, please wait...