Inter Parfums, Inc. (IPAR): Price and Financial Metrics
IPAR Price/Volume Stats
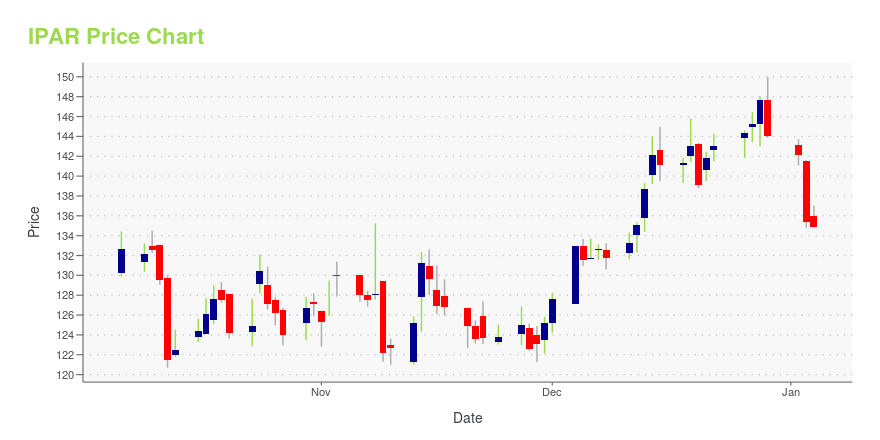
Current price | $125.60 | 52-week high | $161.17 |
Prev. close | $128.31 | 52-week low | $64.52 |
Day low | $125.00 | Volume | 232,800 |
Day high | $128.81 | Avg. volume | 137,710 |
50-day MA | $142.50 | Dividend yield | 1.95% |
200-day MA | $108.41 | Market Cap | 4.02B |
IPAR Stock Price Chart Interactive Chart >
IPAR POWR Grades
- IPAR scores best on the Quality dimension, with a Quality rank ahead of 74.89% of US stocks.
- The strongest trend for IPAR is in Value, which has been heading down over the past 179 days.
- IPAR ranks lowest in Momentum; there it ranks in the 10th percentile.
IPAR Stock Summary
- IPAR's went public 31.78 years ago, making it older than 85.23% of listed US stocks we're tracking.
- Price to trailing twelve month operating cash flow for IPAR is currently 31.82, higher than 86.78% of US stocks with positive operating cash flow.
- Of note is the ratio of INTER PARFUMS INC's sales and general administrative expense to its total operating expenses; 84.4% of US stocks have a lower such ratio.
- Stocks with similar financial metrics, market capitalization, and price volatility to INTER PARFUMS INC are JLL, NUS, AIT, DAVA, and CLWT.
- IPAR's SEC filings can be seen here. And to visit INTER PARFUMS INC's official web site, go to www.interparfumsinc.com.
IPAR Valuation Summary
- In comparison to the median Consumer Defensive stock, IPAR's EV/EBIT ratio is 17.33% higher, now standing at 22.
- IPAR's EV/EBIT ratio has moved up 16.4 over the prior 243 months.
Below are key valuation metrics over time for IPAR.
Stock | Date | P/S | P/B | P/E | EV/EBIT |
---|---|---|---|---|---|
IPAR | 2023-05-23 | 3.7 | 6.4 | 30.1 | 22.0 |
IPAR | 2023-05-22 | 3.7 | 6.5 | 30.5 | 22.2 |
IPAR | 2023-05-19 | 3.7 | 6.5 | 30.8 | 22.4 |
IPAR | 2023-05-18 | 3.7 | 6.5 | 30.5 | 22.3 |
IPAR | 2023-05-17 | 3.8 | 6.6 | 30.9 | 22.5 |
IPAR | 2023-05-16 | 3.8 | 6.6 | 31.1 | 22.7 |
IPAR Growth Metrics
- The 5 year revenue growth rate now stands at 23.07%.
- Its 5 year price growth rate is now at 15.19%.
- Its 2 year cash and equivalents growth rate is now at -22.75%.

The table below shows IPAR's growth in key financial areas (numbers in millions of US dollars).
Date | Revenue | Operating Cash Flow | Net Income to Common Stock |
---|---|---|---|
2022-09-30 | 986.584 | 10.15 | 103.115 |
2022-06-30 | 968.818 | 52.966 | 100.008 |
2022-03-31 | 931.666 | 63.126 | 95.048 |
2021-12-31 | 879.516 | 119.586 | 87.411 |
2021-09-30 | 852.839 | 186.408 | 103.374 |
2021-06-30 | 750.78 | 124.392 | 81.596 |
IPAR's Quality Factors
The “Quality” component of the POWR Ratings focuses on 31 different factors of a companies fundamentals and operational strength. Here are some key insights as we drill into the specifics of these quality attributes.- IPAR has a Quality Grade of C, ranking ahead of 63.97% of graded US stocks.
- IPAR's asset turnover comes in at 0.811 -- ranking 32nd of 50 Consumer Goods stocks.
- COTY, IKNX, and REV are the stocks whose asset turnover ratios are most correlated with IPAR.
The table below shows IPAR's key quality metrics over time.
Period | Asset Turnover | Gross Margin | ROIC |
---|---|---|---|
2021-06-30 | 0.811 | 0.629 | 0.259 |
2021-03-31 | 0.708 | 0.619 | 0.210 |
2020-12-31 | 0.665 | 0.614 | 0.156 |
2020-09-30 | 0.670 | 0.615 | 0.138 |
2020-06-30 | 0.712 | 0.612 | 0.160 |
2020-03-31 | 0.843 | 0.625 | 0.233 |
IPAR Price Target
For more insight on analysts targets of IPAR, see our IPAR price target page. And for a list of of all stocks sorted by upside potential based on analyst target price, see our Top Price Target page.
Average Price Target | $88.00 | Average Broker Recommendation | 1.75 (Moderate Buy) |
Inter Parfums, Inc. (IPAR) Company Bio
Inter Parfums manufactures, markets, and distributes a range of fragrances and fragrance related products worldwide. The company was founded in 1985 and is based in New York, New York.
Latest IPAR News From Around the Web
Below are the latest news stories about INTER PARFUMS INC that investors may wish to consider to help them evaluate IPAR as an investment opportunity.
Boot Barn (BOOT) Q4 Earnings Top Estimates, Sales Rise Y/YBoot Barn (BOOT) fourth-quarter fiscal 2023 results reflect a year-over-year increase in both the top line and bottom line. |
The Zacks Analyst Blog Highlights Celsius Holdings, The Clorox, Lamb Weston Holdings, Coty and Inter ParfumsCelsius Holdings, The Clorox, Lamb Weston Holdings, Coty and Inter Parfums are part of the Zacks top Analyst Blog. |
Zacks.com featured highlights include Inter Parfums, Rockwell Automation and MicroStrategyInter Parfums, Rockwell Automation and MicroStrategy are part of the Zacks Screen of the Week article. |
U.S. Consumer Sentiment Tumbles in May: 5 Safe Stocks to BuyWe have narrowed our search to five consumer staples stocks . These are: CELH, CLX, COTY, LW and IPAR. |
2 Highly-Ranked Stocks to Buy After EarningsAmong the Zacks Rank #1 (Strong Buy) list several stocks are standing out after surpassing quarterly earnings expectations. |
IPAR Price Returns
1-mo | -17.13% |
3-mo | -9.06% |
6-mo | 27.68% |
1-year | 74.28% |
3-year | 182.47% |
5-year | 156.58% |
YTD | 30.74% |
2022 | -7.40% |
2021 | 79.01% |
2020 | -16.23% |
2019 | 12.74% |
2018 | 53.32% |
IPAR Dividends
Ex-Dividend Date | Type | Payout Amount | Change | ||||||
---|---|---|---|---|---|---|---|---|---|
Loading, please wait... |
Continue Researching IPAR
Want to see what other sources are saying about Inter Parfums Inc's financials and stock price? Try the links below:Inter Parfums Inc (IPAR) Stock Price | Nasdaq
Inter Parfums Inc (IPAR) Stock Quote, History and News - Yahoo Finance
Inter Parfums Inc (IPAR) Stock Price and Basic Information | MarketWatch
Loading social stream, please wait...