Interpublic Group of Cos. (IPG): Price and Financial Metrics
IPG Price/Volume Stats
Current price | $28.19 | 52-week high | $40.95 |
Prev. close | $28.65 | 52-week low | $25.73 |
Day low | $28.08 | Volume | 3,076,300 |
Day high | $28.64 | Avg. volume | 4,221,368 |
50-day MA | $31.78 | Dividend yield | 4.28% |
200-day MA | $35.44 | Market Cap | 10.85B |
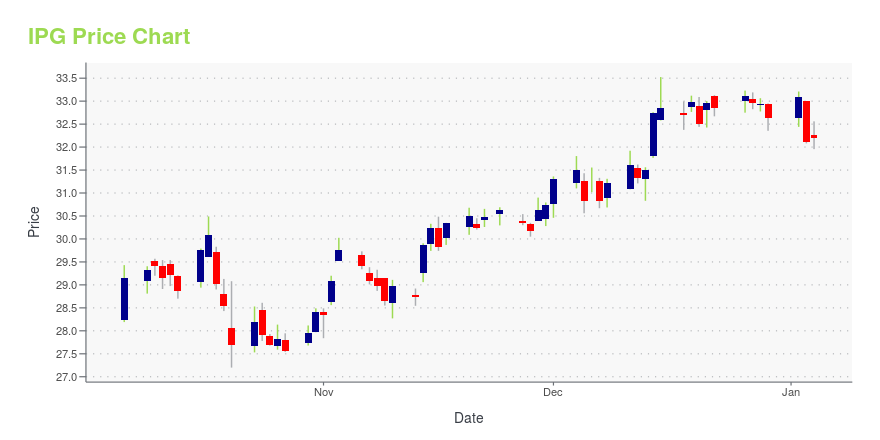
IPG Stock Price Chart Interactive Chart >
IPG POWR Grades
- Quality is the dimension where IPG ranks best; there it ranks ahead of 52.33% of US stocks.
- The strongest trend for IPG is in Stability, which has been heading down over the past 177 days.
- IPG's current lowest rank is in the Momentum metric (where it is better than 22.8% of US stocks).
IPG Stock Summary
- INTERPUBLIC GROUP OF COMPANIES INC's stock had its IPO on November 5, 1987, making it an older stock than 91.15% of US equities in our set.
- Of note is the ratio of INTERPUBLIC GROUP OF COMPANIES INC's sales and general administrative expense to its total operating expenses; just 6.03% of US stocks have a lower such ratio.
- The ratio of debt to operating expenses for INTERPUBLIC GROUP OF COMPANIES INC is higher than it is for about 92.56% of US stocks.
- Stocks that are quantitatively similar to IPG, based on their financial statements, market capitalization, and price volatility, are GSL, LTC, ESBA, BRT, and SBAC.
- Visit IPG's SEC page to see the company's official filings. To visit the company's web site, go to www.interpublic.com.
IPG Valuation Summary
- IPG's price/earnings ratio is 12; this is 22.08% lower than that of the median Communication Services stock.
- Over the past 243 months, IPG's EV/EBIT ratio has gone down 55.2.
Below are key valuation metrics over time for IPG.
Stock | Date | P/S | P/B | P/E | EV/EBIT |
---|---|---|---|---|---|
IPG | 2023-09-21 | 1.0 | 3.1 | 12.0 | 10.4 |
IPG | 2023-09-20 | 1.1 | 3.1 | 12.2 | 10.6 |
IPG | 2023-09-19 | 1.1 | 3.2 | 12.4 | 10.7 |
IPG | 2023-09-18 | 1.1 | 3.2 | 12.5 | 10.7 |
IPG | 2023-09-15 | 1.1 | 3.2 | 12.6 | 10.8 |
IPG | 2023-09-14 | 1.1 | 3.2 | 12.7 | 10.9 |
IPG Growth Metrics
- Its year over year price growth rate is now at 9.54%.
- Its 5 year cash and equivalents growth rate is now at 100.52%.
- Its 5 year net cashflow from operations growth rate is now at 70.18%.

The table below shows IPG's growth in key financial areas (numbers in millions of US dollars).
Date | Revenue | Operating Cash Flow | Net Income to Common Stock |
---|---|---|---|
2022-12-31 | 10,927.8 | 608.8 | 938 |
2022-09-30 | 10,874 | 808.2 | 998.7 |
2022-06-30 | 10,778.3 | 1,132.8 | 986.8 |
2022-03-31 | 10,552.2 | 1,691.8 | 1,020.5 |
2021-12-31 | 10,240.7 | 2,075.6 | 952.8 |
2021-09-30 | 9,858.6 | 2,130.7 | 707.2 |
IPG's Quality Factors
The “Quality” component of the POWR Ratings focuses on 31 different factors of a companies fundamentals and operational strength. Here are some key insights as we drill into the specifics of these quality attributes.- IPG has a Quality Grade of B, ranking ahead of 82.43% of graded US stocks.
- IPG's asset turnover comes in at 0.567 -- ranking 279th of 561 Business Services stocks.
- OMC, WB, and HRTH are the stocks whose asset turnover ratios are most correlated with IPG.
The table below shows IPG's key quality metrics over time.
Period | Asset Turnover | Gross Margin | ROIC |
---|---|---|---|
2021-09-30 | 0.567 | 0.187 | 0.205 |
2021-06-30 | 0.557 | 0.188 | 0.174 |
2021-03-31 | 0.548 | 0.170 | 0.103 |
2020-12-31 | 0.554 | 0.149 | 0.083 |
2020-09-30 | 0.578 | 0.144 | 0.115 |
2020-06-30 | 0.598 | 0.138 | 0.119 |
IPG Price Target
For more insight on analysts targets of IPG, see our IPG price target page. And for a list of of all stocks sorted by upside potential based on analyst target price, see our Top Price Target page.
Average Price Target | $37.91 | Average Broker Recommendation | 1.64 (Moderate Buy) |
Interpublic Group of Cos. (IPG) Company Bio
The Interpublic Group of Companies, Inc. (IPG) is an American publicly traded advertising company. The company consists of five major networks: FCB, IPG Mediabrands, McCann Worldgroup, MullenLowe Group, and Marketing Specialists, as well as a number of independent specialty agencies in the areas of public relations, sports marketing, talent representation, and healthcare. It is one of the "Big Four" agency companies, alongside WPP, Publicis and Omnicom. Phillippe Krakowsky became the company's CEO on January 1, 2021. (Source:Wikipedia)
Latest IPG News From Around the Web
Below are the latest news stories about INTERPUBLIC GROUP OF COMPANIES INC that investors may wish to consider to help them evaluate IPG as an investment opportunity.
Here's Why You Should Retain Interpublic (IPG) Stock for NowInterpublic's (IPG) increasingly diverse workforce gives the company a key competitive edge. |
Why This 1 Value Stock Could Be a Great Addition to Your PortfolioWondering how to pick strong, market-beating stocks for your investment portfolio? Look no further than the Zacks Style Scores. |
Is Now The Time To Look At Buying The Interpublic Group of Companies, Inc. (NYSE:IPG)?Let's talk about the popular The Interpublic Group of Companies, Inc. ( NYSE:IPG ). The company's shares saw... |
IPG Mediabrands Launches Industry’s Most Powerful Delivery Engine Under KINESSO BannerNEW YORK, September 21, 2023--IPG Mediabrands, the media holding company within Interpublic Group (NYSE: IPG) announced today the launch of KINESSO, a tech-driven performance unit delivering real intelligence that moves brands forward. The new entity is poised for accelerated growth through the integration of three powerhouse brands: Kinesso, Reprise, and Matterkind, now living under the KINESSO banner within IPG Mediabrands. |
Sparkling Ice® Embarks on New Era of Campaign Excellence with Dynamic Creative & Media Buying AgenciesSparkling Ice®, the #1 bestselling sparkling water brand, is excited to announce its newest collaboration with two industry powerhouses, Red Tettemer O'Connell + Partners (RTO+P), a leading advertising agency and MRM Media, a full-service global media agency, signaling a transformative chapter in the brand's journey. |
IPG Price Returns
1-mo | N/A |
3-mo | -25.21% |
6-mo | N/A |
1-year | 7.33% |
3-year | 80.18% |
5-year | 47.37% |
YTD | -13.13% |
2022 | -7.82% |
2021 | 64.69% |
2020 | 7.21% |
2019 | 16.96% |
2018 | 6.07% |
IPG Dividends
Ex-Dividend Date | Type | Payout Amount | Change | ||||||
---|---|---|---|---|---|---|---|---|---|
Loading, please wait... |
Loading social stream, please wait...