IQVIA Holdings Inc. (IQV): Price and Financial Metrics
GET POWR RATINGS... FREE!
IQV POWR Grades
- Growth is the dimension where IQV ranks best; there it ranks ahead of 96.7% of US stocks.
- The strongest trend for IQV is in Stability, which has been heading down over the past 177 days.
- IQV ranks lowest in Momentum; there it ranks in the 25th percentile.
IQV Stock Summary
- IQV has a market capitalization of $42,445,310,056 -- more than approximately 94.37% of US stocks.
- With a price/earnings ratio of 35.91, IQVIA HOLDINGS INC P/E ratio is greater than that of about 81.1% of stocks in our set with positive earnings.
- In terms of volatility of its share price, IQV is more volatile than just 18.2% of stocks we're observing.
- If you're looking for stocks that are quantitatively similar to IQVIA HOLDINGS INC, a group of peers worth examining would be ICE, IR, URI, LHX, and FWONA.
- Visit IQV's SEC page to see the company's official filings. To visit the company's web site, go to www.iqvia.com.
IQV Valuation Summary
- IQV's EV/EBIT ratio is 28.9; this is 191.92% higher than that of the median Healthcare stock.
- IQV's EV/EBIT ratio has moved up 10.9 over the prior 118 months.
Below are key valuation metrics over time for IQV.
Stock | Date | P/S | P/B | P/E | EV/EBIT |
---|---|---|---|---|---|
IQV | 2023-01-20 | 2.9 | 7.8 | 35.1 | 28.9 |
IQV | 2023-01-19 | 2.9 | 7.7 | 34.9 | 28.8 |
IQV | 2023-01-18 | 2.9 | 7.7 | 34.7 | 28.6 |
IQV | 2023-01-17 | 2.9 | 7.7 | 34.8 | 28.7 |
IQV | 2023-01-13 | 2.9 | 7.7 | 34.9 | 28.7 |
IQV | 2023-01-12 | 2.8 | 7.6 | 34.5 | 28.5 |
IQV Growth Metrics
- The 5 year net cashflow from operations growth rate now stands at 82.49%.
- The year over year net cashflow from operations growth rate now stands at -3%.
- The 5 year net income to common stockholders growth rate now stands at 161.14%.

The table below shows IQV's growth in key financial areas (numbers in millions of US dollars).
Date | Revenue | Operating Cash Flow | Net Income to Common Stock |
---|---|---|---|
2022-09-30 | 14,307 | 2,392 | 1,182 |
2022-06-30 | 14,136 | 2,373 | 1,160 |
2022-03-31 | 14,033 | 2,583 | 1,079 |
2021-12-31 | 13,874 | 2,942 | 966 |
2021-09-30 | 13,536 | 3,000 | 767 |
2021-06-30 | 12,931 | 2,730 | 607 |
IQV's Quality Factors
The “Quality” component of the POWR Ratings focuses on 31 different factors of a companies fundamentals and operational strength. Here are some key insights as we drill into the specifics of these quality attributes.- IQV has a Quality Grade of C, ranking ahead of 29.06% of graded US stocks.
- IQV's asset turnover comes in at 0.558 -- ranking 289th of 563 Business Services stocks.
- ISSC, MSTR, and TRUE are the stocks whose asset turnover ratios are most correlated with IQV.
The table below shows IQV's key quality metrics over time.
Period | Asset Turnover | Gross Margin | ROIC |
---|---|---|---|
2021-09-30 | 0.558 | 0.332 | 0.104 |
2021-06-30 | 0.534 | 0.336 | 0.089 |
2021-03-31 | 0.500 | 0.337 | 0.070 |
2020-12-31 | 0.480 | 0.340 | 0.058 |
2020-09-30 | 0.469 | 0.340 | 0.051 |
2020-06-30 | 0.474 | 0.334 | 0.049 |
IQV Price Target
For more insight on analysts targets of IQV, see our IQV price target page. And for a list of of all stocks sorted by upside potential based on analyst target price, see our Top Price Target page.
Average Price Target | $200.00 | Average Broker Recommendation | 1.33 (Strong Buy) |
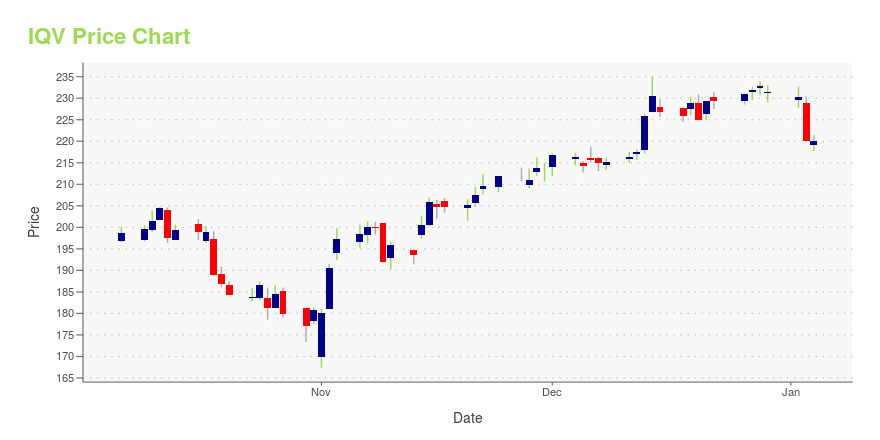
IQV Stock Price Chart Interactive Chart >
IQV Price/Volume Stats
Current price | $226.28 | 52-week high | $256.62 |
Prev. close | $229.47 | 52-week low | $165.75 |
Day low | $225.54 | Volume | 634,300 |
Day high | $229.46 | Avg. volume | 768,463 |
50-day MA | $214.01 | Dividend yield | N/A |
200-day MA | $212.43 | Market Cap | 42.03B |
IQVIA Holdings Inc. (IQV) Company Bio
IQVIA, formerly Quintiles and IMS Health, Inc., is an American multinational company serving the combined industries of health information technology and clinical research. IQVIA is a provider of biopharmaceutical development and commercial outsourcing services, focused primarily on Phase I-IV clinical trials and associated laboratory and analytical services, including consulting services. It has a network of more than 88,000 employees in more than 100 countries and a market capitalization of $49 Billion as of August 2021. As of 2017, IQVIA was reported to be one of the world's largest contract research organizations. (Source:Wikipedia)
Latest IQV News From Around the Web
Below are the latest news stories about IQVIA HOLDINGS INC that investors may wish to consider to help them evaluate IQV as an investment opportunity.
IQVIA to Announce Fourth-Quarter and Full-Year 2022 Results on February 10, 2023RESEARCH TRIANGLE PARK, N.C., January 25, 2023--IQVIA Holdings Inc. ("IQVIA") (NYSE: IQV) will announce its fourth-quarter and full-year 2022 financial results before the market opens on Friday, February 10, 2023. The IQVIA management team will also host a conference call and webcast at 9:00 a.m. Eastern Time on that same day. The earnings release and accompanying financial information will be posted on the IQVIA Investor Relations website at http://ir.iqvia.com. |
IQVIA Holdings: Valuation Is Justified For An Industry Leader (NYSE:IQV)I provide a brief background on IQVIA Holdings and its recent performance. In addition, I defend its premium valuation. Click here to read my analysis of IQV. |
Here's Why IQVIA Holdings (NYSE:IQV) Has Caught The Eye Of InvestorsFor beginners, it can seem like a good idea (and an exciting prospect) to buy a company that tells a good story to... |
IQVIA Holdings. – Consensus Indicates Potential 14.7% UpsideIQVIA Holdings. with ticker code (IQV) now have 20 analysts covering the stock. The analyst consensus points to a rating of ''Buy''. The target price ranges between 285 and 230 with a mean TP of 254.15. Now with the previous closing price of 221.54 this now indicates there is a potential upside of 14.7%. The 50 day moving average now sits at 211.85 and the 200 day moving average is 213.13. The market capitalisation for the company is $40,965m. Company Website: https://www.iqvia.com [stock_market_widget type="chart" template="basic" color="green" assets="IQV" range="6mo" interval="1d" axes="true" cursor="true" api="yf"] The potential market cap would be $46,995m based on the market concensus. IQVIA Holdings Inc. provides advanced analytics, technology solutions, and clinical research ser... |
Global Market for Medicines to Rise to $1.9 Trillion by 2027, says Report from IQVIA InstituteRESEARCH TRIANGLE PARK, N.C., January 18, 2023--The total spending and global demand for medicines will increase over the next five years to approximately $1.9 trillion by 2027, according to a new report titled Global Use of Medicines 2023 – Outlook through 2027 from the IQVIA Institute for Human Data Science. |
IQV Price Returns
1-mo | 10.44% |
3-mo | 10.73% |
6-mo | -3.44% |
1-year | -7.60% |
3-year | 45.75% |
5-year | 117.33% |
YTD | 10.44% |
2022 | -27.38% |
2021 | 57.47% |
2020 | 15.96% |
2019 | 33.00% |
2018 | 18.66% |
Continue Researching IQV
Here are a few links from around the web to help you further your research on Iqvia Holdings Inc's stock as an investment opportunity:Iqvia Holdings Inc (IQV) Stock Price | Nasdaq
Iqvia Holdings Inc (IQV) Stock Quote, History and News - Yahoo Finance
Iqvia Holdings Inc (IQV) Stock Price and Basic Information | MarketWatch
Loading social stream, please wait...