
IRIDEX Corporation (IRIX): Price and Financial Metrics
IRIX Price/Volume Stats
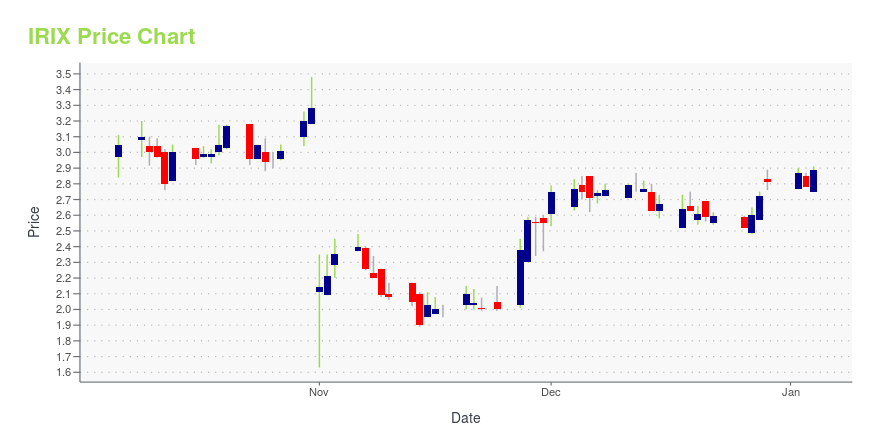
| Current price | $2.05 | 52-week high | $3.65 |
| Prev. close | $1.99 | 52-week low | $1.31 |
| Day low | $2.03 | Volume | 48,187 |
| Day high | $2.09 | Avg. volume | 32,624 |
| 50-day MA | $2.21 | Dividend yield | N/A |
| 200-day MA | $2.60 | Market Cap | 33.32M |
IRIX Stock Price Chart Interactive Chart >
IRIDEX Corporation (IRIX) Company Bio
IRIDEX Corporation develops, manufactures, markets, sells, and services medical laser systems and associated instrumentation for the treatment of the sight-threatening eye diseases. The company was formerly known as IRIS Medical Instruments, Inc. and changed its name to IRIDEX Corporation in November 1995. The company was founded in 1989 and is based in Mountain View, California.
Latest IRIX News From Around the Web
Below are the latest news stories about IRIDEX CORP that investors may wish to consider to help them evaluate IRIX as an investment opportunity.
Iridex Corporation Announces Successful Appeal for Revision of Recent Medicare LCDs to Provide Broader Coverage of CyclophotocoagulationMOUNTAIN VIEW, Calif., Nov. 27, 2023 (GLOBE NEWSWIRE) -- Iridex Corporation (NASDAQ: IRIX), a worldwide leader providing innovative and versatile laser-based medical systems, delivery devices, and procedure probes for the treatment of glaucoma and retinal diseases, today announced its successful advocacy for revision of the recently issued Medicare Local Coverage Determinations (LCDs) for Cyclophotocoagulation (CPC). During the last few days, the five Medicare Administrative Contractors (MACs) t |
Iridex Reports Third Quarter 2023 Financial Results and Business UpdateMOUNTAIN VIEW, Calif., Nov. 14, 2023 (GLOBE NEWSWIRE) -- Iridex Corporation (Nasdaq: IRIX), a worldwide leader providing innovative and versatile laser-based medical systems, delivery devices, and procedure probes for the treatment of glaucoma and retinal diseases, today reported financial results for the third quarter ended September 30, 2023 and provided a business update. Recent Business Updates Generated total revenue of $12.9 million, representing flat sequential quarter revenue and a decre |
Iridex to Host Third Quarter Financial Results Conference Call on November 14, 2023The Company also announced plans to present at Stifel Healthcare ConferenceMOUNTAIN VIEW, Calif., Nov. 13, 2023 (GLOBE NEWSWIRE) -- Iridex Corporation (NASDAQ: IRIX), a provider of innovative ophthalmic laser-based medical products for the treatment of glaucoma and retinal diseases, today announced the Company will host its third quarter financial results conference call on November 14, 2023 and plans to participate in the upcoming Stifel Healthcare Conference on November 15, 2023 in New York, N |
Iridex to Report Third Quarter Financial Results on November 14, 2023MOUNTAIN VIEW, Calif., Oct. 26, 2023 (GLOBE NEWSWIRE) -- Iridex Corporation (NASDAQ: IRIX), a provider of innovative ophthalmic laser-based medical products for the treatment of glaucoma and retinal diseases, today announced the Company will release financial results for the third quarter of 2023 after the close of trading on Tuesday, November 14, 2023. About IridexIridex Corporation is a worldwide leader in developing, manufacturing, and marketing innovative and versatile laser-based medical sy |
IRIDEX's (NASDAQ:IRIX) growing losses don't faze investors as the stock surges 18% this past weekOne simple way to benefit from the stock market is to buy an index fund. But many of us dare to dream of bigger... |
IRIX Price Returns
| 1-mo | -7.24% |
| 3-mo | -28.57% |
| 6-mo | -27.56% |
| 1-year | 1.49% |
| 3-year | -68.27% |
| 5-year | -42.58% |
| YTD | -27.05% |
| 2023 | 39.80% |
| 2022 | -67.10% |
| 2021 | 143.43% |
| 2020 | 12.56% |
| 2019 | -52.55% |
Continue Researching IRIX
Want to do more research on Iridex Corp's stock and its price? Try the links below:Iridex Corp (IRIX) Stock Price | Nasdaq
Iridex Corp (IRIX) Stock Quote, History and News - Yahoo Finance
Iridex Corp (IRIX) Stock Price and Basic Information | MarketWatch
Loading social stream, please wait...