
Ironwood Pharmaceuticals, Inc. - (IRWD): Price and Financial Metrics
IRWD Price/Volume Stats
| Current price | $7.04 | 52-week high | $15.70 |
| Prev. close | $6.79 | 52-week low | $5.47 |
| Day low | $6.86 | Volume | 1,100,036 |
| Day high | $7.11 | Avg. volume | 3,525,471 |
| 50-day MA | $6.39 | Dividend yield | N/A |
| 200-day MA | $9.39 | Market Cap | 1.10B |
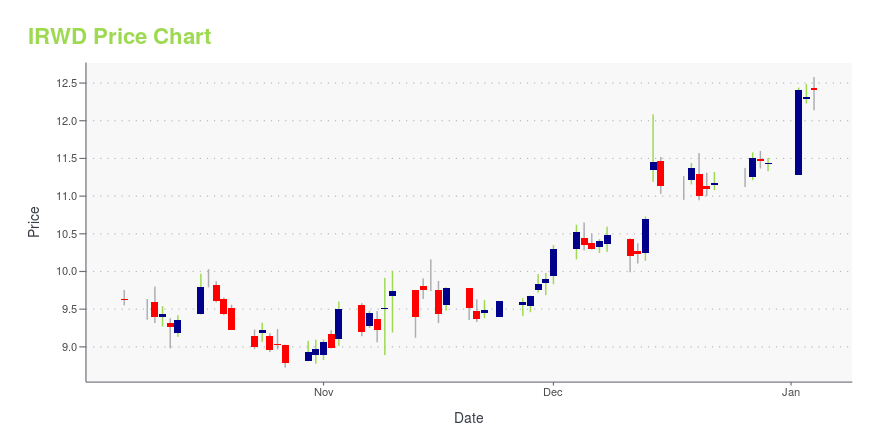
IRWD Stock Price Chart Interactive Chart >
Ironwood Pharmaceuticals, Inc. - (IRWD) Company Bio
Ironwood Pharmaceuticals engages in the research, development, and commercialization of human therapeutic products, with a key focus being the treatment of adult men and women suffering from irritable bowel syndrome. The company was founded in 1998 and is based in Cambridge, Massachusetts.
Latest IRWD News From Around the Web
Below are the latest news stories about IRONWOOD PHARMACEUTICALS INC that investors may wish to consider to help them evaluate IRWD as an investment opportunity.
Ironwood Announces the Completion of Squeeze-Out Merger With VectivBioBOSTON, December 12, 2023--Ironwood Pharmaceuticals, Inc. ("Ironwood") (Nasdaq: IRWD), a GI-focused healthcare company, today announced the successful completion of the squeeze-out merger under Swiss law (the "Squeeze-Out Merger") pursuant to which VectivBio Holding AG ("VectivBio") has been merged with and into Ironwood Pharmaceuticals GmbH ("Merger Sub"), a wholly-owned subsidiary of Ironwood organized under the laws of Switzerland. As a result of the Squeeze-Out Merger, all remaining outstand |
Shareholders have faith in loss-making Ironwood Pharmaceuticals (NASDAQ:IRWD) as stock climbs 9.7% in past week, taking five-year gain to 2.3%While not a mind-blowing move, it is good to see that the Ironwood Pharmaceuticals, Inc. ( NASDAQ:IRWD ) share price... |
Stonegate Healthcare Partners Releases Report on Transformative Therapies for Pruritus ManagementDallas, Texas--(Newsfile Corp. - November 30, 2023) - Stonegate Healthcare Partners is pleased to announce the publication of its latest report, titled "Transformative Therapies for Pruritus Management." This comprehensive report delves into the critical issue of pruritus, or chronic itch, and its impact on patients, particularly those suffering from Primary Biliary Cholangitis (PBC), an autoimmune liver disease. ... |
Ironwood Pharmaceuticals to Participate in the Piper Sandler 35th Annual Healthcare ConferenceBOSTON, November 21, 2023--Ironwood Pharmaceuticals, Inc. (Nasdaq: IRWD) will participate in a fireside chat at the Piper Sandler 35th Annual Healthcare Conference on Wednesday, November 29, 2023 at 9:00 a.m. ET at the Lotte New York Palace. |
Ironwood Pharmaceuticals, Inc. (NASDAQ:IRWD) Q3 2023 Earnings Call TranscriptIronwood Pharmaceuticals, Inc. (NASDAQ:IRWD) Q3 2023 Earnings Call Transcript November 9, 2023 Ironwood Pharmaceuticals, Inc. misses on earnings expectations. Reported EPS is $0.09 EPS, expectations were $0.17. Operator: Thank you for standing by. My name is Aaron, and I will be your conference operator for today. At this time, I would like to welcome everyone […] |
IRWD Price Returns
| 1-mo | 13.92% |
| 3-mo | -9.97% |
| 6-mo | -47.42% |
| 1-year | -35.12% |
| 3-year | -46.26% |
| 5-year | -32.37% |
| YTD | -38.46% |
| 2023 | -7.67% |
| 2022 | 6.26% |
| 2021 | 2.37% |
| 2020 | -14.43% |
| 2019 | 28.47% |
Continue Researching IRWD
Here are a few links from around the web to help you further your research on Ironwood Pharmaceuticals Inc's stock as an investment opportunity:Ironwood Pharmaceuticals Inc (IRWD) Stock Price | Nasdaq
Ironwood Pharmaceuticals Inc (IRWD) Stock Quote, History and News - Yahoo Finance
Ironwood Pharmaceuticals Inc (IRWD) Stock Price and Basic Information | MarketWatch
Loading social stream, please wait...