Intra-Cellular Therapies Inc. (ITCI): Price and Financial Metrics
GET POWR RATINGS... FREE!
ITCI POWR Grades
- Sentiment is the dimension where ITCI ranks best; there it ranks ahead of 94.7% of US stocks.
- The strongest trend for ITCI is in Quality, which has been heading up over the past 179 days.
- ITCI ranks lowest in Stability; there it ranks in the 18th percentile.
ITCI Stock Summary
- With a price/sales ratio of 24.12, INTRA-CELLULAR THERAPIES INC has a higher such ratio than 94.56% of stocks in our set.
- ITCI's equity multiplier -- a measure of assets relative to shareholders'equity -- is greater than that of only 10.15% of US stocks.
- As for revenue growth, note that ITCI's revenue has grown 166.5% over the past 12 months; that beats the revenue growth of 94.96% of US companies in our set.
- Stocks with similar financial metrics, market capitalization, and price volatility to INTRA-CELLULAR THERAPIES INC are VORB, STRM, RNLX, LVOX, and SSYS.
- ITCI's SEC filings can be seen here. And to visit INTRA-CELLULAR THERAPIES INC's official web site, go to www.intracellulartherapies.com.
ITCI Valuation Summary
- In comparison to the median Healthcare stock, ITCI's price/sales ratio is 1028.57% higher, now standing at 23.7.
- ITCI's price/sales ratio has moved NA NA over the prior 110 months.
Below are key valuation metrics over time for ITCI.
Stock | Date | P/S | P/B | P/E | EV/EBIT |
---|---|---|---|---|---|
ITCI | 2023-01-30 | 23.7 | 6.5 | -14.9 | -14.6 |
ITCI | 2023-01-27 | 24.0 | 6.6 | -15.2 | -14.8 |
ITCI | 2023-01-26 | 24.6 | 6.7 | -15.5 | -15.1 |
ITCI | 2023-01-25 | 24.3 | 6.7 | -15.3 | -15.0 |
ITCI | 2023-01-24 | 24.6 | 6.8 | -15.5 | -15.2 |
ITCI | 2023-01-23 | 24.4 | 6.7 | -15.4 | -15.1 |
ITCI Growth Metrics
- The 5 year cash and equivalents growth rate now stands at 666.97%.
- Its 5 year price growth rate is now at 73.95%.
- The 2 year net income to common stockholders growth rate now stands at -89.34%.

The table below shows ITCI's growth in key financial areas (numbers in millions of US dollars).
Date | Revenue | Operating Cash Flow | Net Income to Common Stock |
---|---|---|---|
2022-09-30 | 188.1159 | -304.1775 | -297.9639 |
2022-06-30 | 138.4531 | -330.0933 | -321.3639 |
2022-03-31 | 102.9207 | -294.6255 | -303.5047 |
2021-12-31 | 83.80302 | -259.5435 | -284.1257 |
2021-09-30 | 70.58636 | -254.6017 | -259.0909 |
2021-06-30 | 55.74775 | -238.914 | -237.3665 |
ITCI's Quality Factors
The “Quality” component of the POWR Ratings focuses on 31 different factors of a companies fundamentals and operational strength. Here are some key insights as we drill into the specifics of these quality attributes.- ITCI has a Quality Grade of D, ranking ahead of 18.25% of graded US stocks.
- ITCI's asset turnover comes in at 0.08 -- ranking 278th of 682 Pharmaceutical Products stocks.
- BHVN, OCX, and BTX are the stocks whose asset turnover ratios are most correlated with ITCI.
The table below shows ITCI's key quality metrics over time.
Period | Asset Turnover | Gross Margin | ROIC |
---|---|---|---|
2021-06-30 | 0.080 | 0.907 | -0.448 |
2021-03-31 | 0.058 | 0.913 | -0.480 |
2020-12-31 | 0.038 | 0.917 | -0.536 |
2020-09-30 | 0.021 | 0.928 | -0.703 |
2020-06-30 | 0.008 | 0.935 | -0.843 |
2020-03-31 | 0.003 | 0.939 | -0.803 |
ITCI Price Target
For more insight on analysts targets of ITCI, see our ITCI price target page. And for a list of of all stocks sorted by upside potential based on analyst target price, see our Top Price Target page.
Average Price Target | $50.44 | Average Broker Recommendation | 1.27 (Strong Buy) |
ITCI Stock Price Chart Interactive Chart >
ITCI Price/Volume Stats
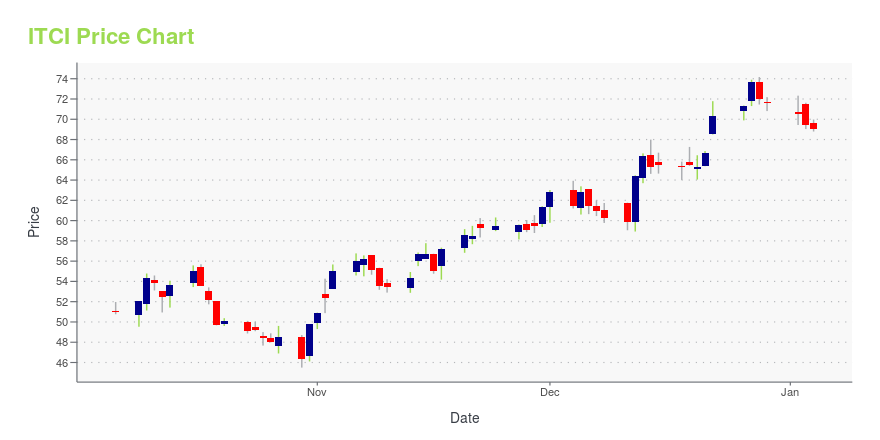
Current price | $49.74 | 52-week high | $66.00 |
Prev. close | $47.82 | 52-week low | $42.42 |
Day low | $47.09 | Volume | 679,131 |
Day high | $49.78 | Avg. volume | 605,245 |
50-day MA | $50.87 | Dividend yield | N/A |
200-day MA | $51.97 | Market Cap | 4.71B |
Intra-Cellular Therapies Inc. (ITCI) Company Bio
Intra-Cellular Therapies is developing novel drugs for the treatment of neuropsychiatric and neurodegenerative diseases and diseases of the elderly, including Parkinson's and Alzheimer's disease. The company was founded in 2002 and is based in New York, New York.
Latest ITCI News From Around the Web
Below are the latest news stories about INTRA-CELLULAR THERAPIES INC that investors may wish to consider to help them evaluate ITCI as an investment opportunity.
Investing in Intra-Cellular Therapies Inc. (ITCI) might be an excellent idea, but the stock is currently overvalued/undervaluedAs of Thursday, Intra-Cellular Therapies Inc.’s (NASDAQ:ITCI) stock closed at $48.52, up from $47.72 the previous day. While Intra-Cellular Therapies Inc. has overperformed by 1.68%, investors are advised to look at stock chart patterns for technical insight. Within its last year performance, ITCI rose by 20.16%, with highs and lows ranging from $66.00 to $38.51, […] |
Intra-Cellular Therapies to Present at the 41st Annual J.P. Morgan Healthcare ConferenceNEW YORK, Jan. 03, 2023 (GLOBE NEWSWIRE) -- Intra-Cellular Therapies, Inc. (Nasdaq: ITCI), a biopharmaceutical company focused on the development and commercialization of therapeutics for central nervous system (CNS) disorders, today announced that Sharon Mates, Ph.D., Chief Executive Officer and Chairman, is scheduled to present at the 41 st Annual J.P. Morgan Healthcare Conference on Monday, January 9, 2023 at 11:15 a.m. PT. |
The Zacks Analyst Blog Highlights United Therapeutics, Intra-Cellular Therapies, Immunocore Holdings and Eli LillyUnited Therapeutics, Intra-Cellular Therapies, Immunocore Holdings and Eli Lilly are part of the Zacks top Analyst Blog. |
Has IntraCellular Therapies (ITCI) Outpaced Other Medical Stocks This Year?Here is how Intra-Cellular Therapies (ITCI) and RxSight, Inc. (RXST) have performed compared to their sector so far this year. |
Is Intra-Cellular Therapies (ITCI) a Worthy Investment Option?TimesSquare Capital Management, an equity investment management company, released its “U.S. Small Cap Growth Strategy” third-quarter investor letter. A copy of the same can be downloaded here. In the third quarter, the strategy outperformed the Russell 2000 Growth Index and returned 3.28% (net), and the index return was 0.24%. Strength in Industrials, Consumer Staples, Consumer Discretionary, […] |
ITCI Price Returns
1-mo | -3.72% |
3-mo | -2.89% |
6-mo | -17.09% |
1-year | 3.50% |
3-year | 120.09% |
5-year | 207.23% |
YTD | -6.01% |
2022 | 1.11% |
2021 | 64.59% |
2020 | -7.32% |
2019 | 201.23% |
2018 | -21.34% |
Loading social stream, please wait...