Iteris, Inc. (ITI): Price and Financial Metrics
GET POWR RATINGS... FREE!
ITI POWR Grades
- ITI scores best on the Stability dimension, with a Stability rank ahead of 76.29% of US stocks.
- ITI's strongest trending metric is Quality; it's been moving down over the last 177 days.
- ITI ranks lowest in Quality; there it ranks in the 20th percentile.
ITI Stock Summary
- The ratio of debt to operating expenses for ITERIS INC is higher than it is for about just 18.49% of US stocks.
- With a year-over-year growth in debt of -27.7%, ITERIS INC's debt growth rate surpasses just 11.33% of about US stocks.
- Over the past twelve months, ITI has reported earnings growth of 319.64%, putting it ahead of 94.84% of US stocks in our set.
- Stocks with similar financial metrics, market capitalization, and price volatility to ITERIS INC are MYGN, PWFL, BIOL, AWH, and XERS.
- Visit ITI's SEC page to see the company's official filings. To visit the company's web site, go to www.iteris.com.
ITI Valuation Summary
- In comparison to the median Technology stock, ITI's price/sales ratio is 60.71% lower, now standing at 1.1.
- Over the past 243 months, ITI's EV/EBIT ratio has gone down 7.8.
Below are key valuation metrics over time for ITI.
Stock | Date | P/S | P/B | P/E | EV/EBIT |
---|---|---|---|---|---|
ITI | 2023-01-31 | 1.1 | 2.4 | -8.9 | -9.1 |
ITI | 2023-01-30 | 1.1 | 2.2 | -8.3 | -8.5 |
ITI | 2023-01-27 | 1.1 | 2.2 | -8.3 | -8.5 |
ITI | 2023-01-26 | 1.1 | 2.3 | -8.5 | -8.7 |
ITI | 2023-01-25 | 1.0 | 2.2 | -8.2 | -8.4 |
ITI | 2023-01-24 | 1.0 | 2.2 | -8.1 | -8.4 |
ITI Growth Metrics
- Its 3 year net income to common stockholders growth rate is now at 9.42%.
- The 5 year net cashflow from operations growth rate now stands at -231.83%.
- The 5 year price growth rate now stands at -8.93%.

The table below shows ITI's growth in key financial areas (numbers in millions of US dollars).
Date | Revenue | Operating Cash Flow | Net Income to Common Stock |
---|---|---|---|
2022-12-31 | 147.848 | -14.755 | -17.425 |
2022-09-30 | 139.166 | -18.216 | -17.806 |
2022-06-30 | 133.154 | -14.189 | -12.556 |
2022-03-31 | 133.572 | -5.721 | -7.08 |
2021-12-31 | 131.048 | 2.652 | -4.381 |
2021-09-30 | 127.214 | 2.831 | -2.163 |
ITI's Quality Factors
The “Quality” component of the POWR Ratings focuses on 31 different factors of a companies fundamentals and operational strength. Here are some key insights as we drill into the specifics of these quality attributes.- ITI has a Quality Grade of C, ranking ahead of 65.3% of graded US stocks.
- ITI's asset turnover comes in at 1.008 -- ranking 42nd of 208 Electronic Equipment stocks.
- LITE, QUIK, and SGH are the stocks whose asset turnover ratios are most correlated with ITI.
The table below shows ITI's key quality metrics over time.
Period | Asset Turnover | Gross Margin | ROIC |
---|---|---|---|
2021-09-30 | 1.008 | 0.392 | -0.061 |
2021-06-30 | 0.997 | 0.406 | 0.013 |
2021-03-31 | 0.981 | 0.400 | 0.208 |
2021-03-31 | 0.981 | 0.400 | 0.208 |
2020-12-31 | 1.027 | 0.412 | 0.211 |
2020-09-30 | 1.078 | 0.412 | 0.171 |
ITI Price Target
For more insight on analysts targets of ITI, see our ITI price target page. And for a list of of all stocks sorted by upside potential based on analyst target price, see our Top Price Target page.
Average Price Target | $9.50 | Average Broker Recommendation | 1.38 (Strong Buy) |
ITI Stock Price Chart Interactive Chart >
ITI Price/Volume Stats
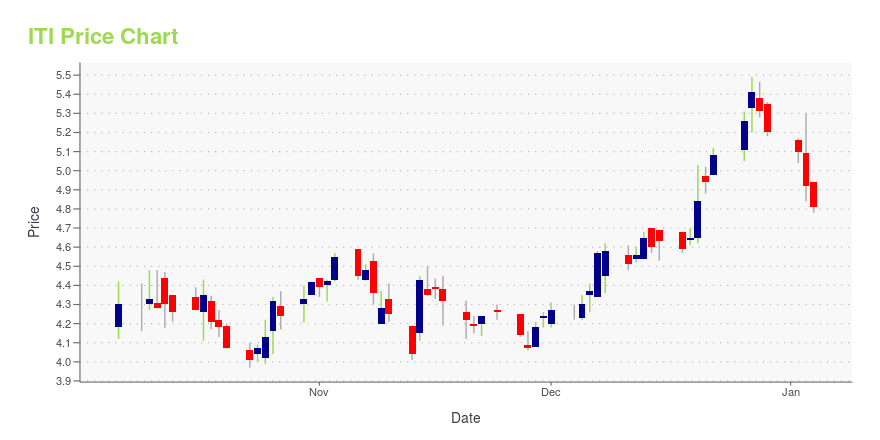
Current price | $4.69 | 52-week high | $4.70 |
Prev. close | $4.58 | 52-week low | $2.40 |
Day low | $4.46 | Volume | 134,749 |
Day high | $4.70 | Avg. volume | 125,750 |
50-day MA | $3.28 | Dividend yield | N/A |
200-day MA | $2.99 | Market Cap | 199.98M |
Iteris, Inc. (ITI) Company Bio
Iteris, Inc. provides intelligent information solutions to the traffic management market worldwide. It operates in three segments: Roadway Sensors, Transportation Systems, and Performance Analytics. The comapny was founded in 1969 and is based in Santa Ana, California.
Latest ITI News From Around the Web
Below are the latest news stories about ITERIS INC that investors may wish to consider to help them evaluate ITI as an investment opportunity.
Iteris, Inc. (NASDAQ:ITI) Q3 2023 Earnings Call TranscriptIteris, Inc. (NASDAQ:ITI) Q3 2023 Earnings Call Transcript February 2, 2023 Operator: Good day and welcome to the Iteris Fiscal Third Quarter 2023 Financial Results Conference Call. At this time, all participants have been placed on a listen-only mode. And we will open the floor for your questions and comments after the presentation. Please note, […] |
Iteris (ITI) Reports Q3 Loss, Tops Revenue EstimatesIteris (ITI) delivered earnings and revenue surprises of 16.67% and 7.55%, respectively, for the quarter ended December 2022. Do the numbers hold clues to what lies ahead for the stock? |
Iteris Reports Record Fiscal 2023 Third Quarter Total Revenue of $40.7 Million, Up 27% Year Over Year, and Record Total Ending Backlog of $112.2 Million, up 22% Year Over YearAUSTIN, Texas, February 02, 2023--Iteris, Inc. (NASDAQ: ITI) today reported financial results for its fiscal third quarter 2023, ended December 31, 2022. |
Iteris Names Kerry A. Shiba New Chief Financial OfficerAUSTIN, Texas, February 02, 2023--Iteris today announced that Kerry A. Shiba will join the company as senior vice president & CFO effective February 3, 2023. |
Otonomo Selected by Iteris to Support Traffic Intelligence Solutions for Public Sector and Commercial Enterprise MarketsMulti-year Agreement Helps Iteris Unlock New Mobility Insights Using Granular, Highly Accurate Data Available Uniquely Through the Otonomo Smart Mobility Data PlatformHERZLIYA, Israel and SAN FRANCISCO and AUSTIN, Texas, Jan. 19, 2023 (GLOBE NEWSWIRE) -- Otonomo Technologies Ltd. (Nasdaq: OTMO), the platform powering the mobility economy, and Iteris (Nasdaq: ITI), the world’s trusted technology ecosystem for smart mobility infrastructure management, today announced a multi-year agreement to inte |
ITI Price Returns
1-mo | 36.34% |
3-mo | 57.38% |
6-mo | 40.00% |
1-year | 40.42% |
3-year | -15.50% |
5-year | -19.69% |
YTD | 50.80% |
2022 | -22.25% |
2021 | -29.20% |
2020 | 13.23% |
2019 | 33.78% |
2018 | -46.48% |
Continue Researching ITI
Want to do more research on Iteris Inc's stock and its price? Try the links below:Iteris Inc (ITI) Stock Price | Nasdaq
Iteris Inc (ITI) Stock Quote, History and News - Yahoo Finance
Iteris Inc (ITI) Stock Price and Basic Information | MarketWatch
Loading social stream, please wait...