
Jack in the Box Inc. (JACK): Price and Financial Metrics
JACK Price/Volume Stats
| Current price | $56.80 | 52-week high | $99.56 |
| Prev. close | $57.61 | 52-week low | $46.10 |
| Day low | $55.77 | Volume | 468,700 |
| Day high | $58.67 | Avg. volume | 486,474 |
| 50-day MA | $53.07 | Dividend yield | 3.13% |
| 200-day MA | $65.91 | Market Cap | 1.10B |
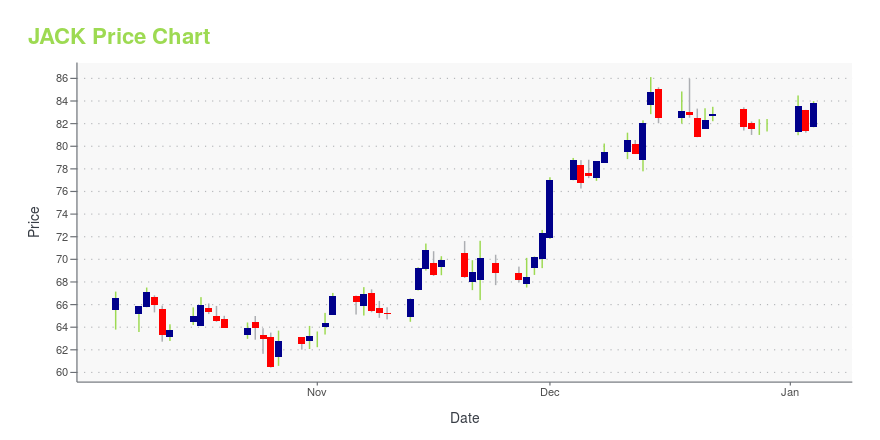
JACK Stock Price Chart Interactive Chart >
Jack in the Box Inc. (JACK) Company Bio
Jack In the Box operates and franchises Jack in the Box quick-service restaurants and Qdoba Mexican Grill fast-casual restaurants in the United States. The company was founded in 1951 and is based in San Diego, California.
Latest JACK News From Around the Web
Below are the latest news stories about JACK IN THE BOX INC that investors may wish to consider to help them evaluate JACK as an investment opportunity.
Jack In The Box Inc Director & CEO Darin Harris Sells 3,823 SharesDarin Harris, Director & CEO of Jack In The Box Inc (NASDAQ:JACK), sold 3,823 shares of the company on December 21, 2023, according to a SEC Filing. |
Why Is Jack In The Box (JACK) Up 15.3% Since Last Earnings Report?Jack In The Box (JACK) reported earnings 30 days ago. What's next for the stock? We take a look at earnings estimates for some clues. |
Jack In The Box Inc Director & CEO Darin Harris Sells Company SharesOn December 19, 2023, Darin Harris, Director & CEO of Jack In The Box Inc, executed a sale of 1,898 shares of the company. |
Enrique Ramirez Mena Joins Jack in the Box Inc. Board of DirectorsSAN DIEGO, December 19, 2023--Jack in the Box Inc. (NASDAQ: JACK) announced that Enrique Ramirez Mena has joined the company’s Board of Directors, effective January 15, 2024. Ramirez Mena currently serves as president and chief financial officer of Buff City Soap, a franchisor offering handmade and plant-based personal care products with over 250 locations across the country. Before joining Buff City Soap, he spent 12 years at Yum! Brands in various executive leadership roles, both domestically |
Here's Why You Should Retain Jack in the Box (JACK) StockJack in the Box's (JACK) focus on the implementation of a new point-of-sale provider bodes well. However, inflationary pressures are a concern. |
JACK Price Returns
| 1-mo | 11.20% |
| 3-mo | -2.63% |
| 6-mo | -25.91% |
| 1-year | -39.81% |
| 3-year | -45.04% |
| 5-year | -17.12% |
| YTD | -29.45% |
| 2023 | 22.24% |
| 2022 | -20.18% |
| 2021 | -4.11% |
| 2020 | 20.74% |
| 2019 | 2.50% |
JACK Dividends
| Ex-Dividend Date | Type | Payout Amount | Change | ||||||
|---|---|---|---|---|---|---|---|---|---|
| Loading, please wait... | |||||||||
Continue Researching JACK
Here are a few links from around the web to help you further your research on Jack In The Box Inc's stock as an investment opportunity:Jack In The Box Inc (JACK) Stock Price | Nasdaq
Jack In The Box Inc (JACK) Stock Quote, History and News - Yahoo Finance
Jack In The Box Inc (JACK) Stock Price and Basic Information | MarketWatch
Loading social stream, please wait...