JetBlue Airways Corporation (JBLU): Price and Financial Metrics
JBLU Price/Volume Stats
Current price | $7.42 | 52-week high | $9.45 |
Prev. close | $7.41 | 52-week low | $3.42 |
Day low | $7.34 | Volume | 8,128,705 |
Day high | $7.52 | Avg. volume | 17,719,037 |
50-day MA | $6.43 | Dividend yield | N/A |
200-day MA | $5.98 | Market Cap | 2.52B |
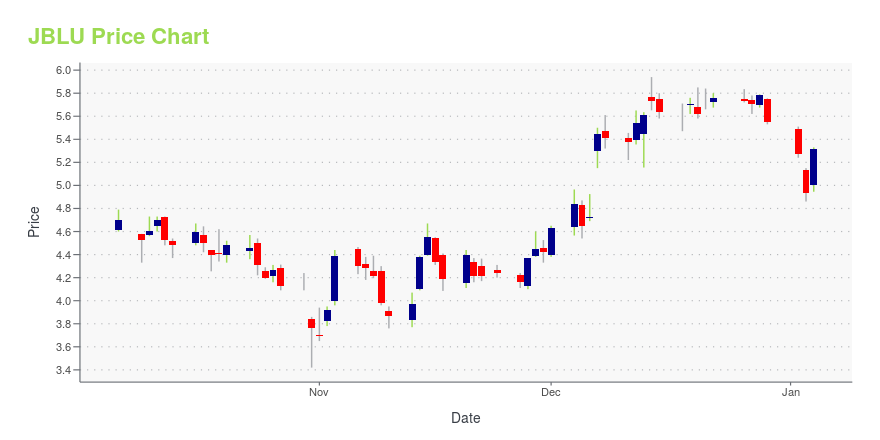
JBLU Stock Price Chart Interactive Chart >
JBLU POWR Grades
- JBLU scores best on the Value dimension, with a Value rank ahead of 47.56% of US stocks.
- The strongest trend for JBLU is in Growth, which has been heading down over the past 26 weeks.
- JBLU ranks lowest in Growth; there it ranks in the 0th percentile.
JBLU Stock Summary
- The price/operating cash flow metric for JETBLUE AIRWAYS CORP is higher than only 9.65% of stocks in our set with a positive cash flow.
- JBLU's price/sales ratio is 0.17; that's higher than the P/S ratio of merely 4.54% of US stocks.
- JETBLUE AIRWAYS CORP's shareholder yield -- a measure of how much capital is returned to stockholders via dividends and buybacks -- is 14.55%, greater than the shareholder yield of 88.36% of stocks in our set.
- If you're looking for stocks that are quantitatively similar to JETBLUE AIRWAYS CORP, a group of peers worth examining would be HAIN, DWSN, UGI, TCS, and ULH.
- JBLU's SEC filings can be seen here. And to visit JETBLUE AIRWAYS CORP's official web site, go to www.jetblue.com.
JBLU Valuation Summary
- In comparison to the median Industrials stock, JBLU's EV/EBIT ratio is 1250% lower, now standing at -200.1.
- Over the past 243 months, JBLU's price/sales ratio has gone down 2.7.
Below are key valuation metrics over time for JBLU.
Stock | Date | P/S | P/B | P/E | EV/EBIT |
---|---|---|---|---|---|
JBLU | 2023-12-29 | 0.2 | 0.5 | -10.1 | -200.1 |
JBLU | 2023-12-28 | 0.2 | 0.6 | -10.5 | -203.0 |
JBLU | 2023-12-27 | 0.2 | 0.6 | -10.4 | -202.1 |
JBLU | 2023-12-26 | 0.2 | 0.6 | -10.4 | -202.4 |
JBLU | 2023-12-22 | 0.2 | 0.6 | -10.5 | -202.7 |
JBLU | 2023-12-21 | 0.2 | 0.6 | -10.4 | -202.4 |
JBLU Growth Metrics
- Its 2 year revenue growth rate is now at -9.85%.
- Its 4 year cash and equivalents growth rate is now at 236.07%.
- The 3 year net cashflow from operations growth rate now stands at 49.78%.
The table below shows JBLU's growth in key financial areas (numbers in millions of US dollars).
Date | Revenue | Operating Cash Flow | Net Income to Common Stock |
---|---|---|---|
2022-12-31 | 9,158 | 379 | -362 |
2022-09-30 | 8,577 | 208 | -515 |
2022-06-30 | 7,987 | 283 | -442 |
2022-03-31 | 7,041 | 1,712 | -190 |
2021-12-31 | 6,037 | 1,642 | -182 |
2021-09-30 | 4,866 | 1,295 | -426 |
JBLU's Quality Factors
The “Quality” component of the POWR Ratings focuses on 31 different factors of a companies fundamentals and operational strength. Here are some key insights as we drill into the specifics of these quality attributes.- JBLU has a Quality Grade of C, ranking ahead of 41.35% of graded US stocks.
- JBLU's asset turnover comes in at 0.247 -- ranking 79th of 137 Transportation stocks.
- ALK, EXPE, and CCL are the stocks whose asset turnover ratios are most correlated with JBLU.
The table below shows JBLU's key quality metrics over time.
Period | Asset Turnover | Gross Margin | ROIC |
---|---|---|---|
2021-06-30 | 0.247 | 0.464 | -0.084 |
2021-03-31 | 0.154 | 0.384 | -0.122 |
2020-12-31 | 0.222 | 0.488 | -0.132 |
2020-09-30 | 0.335 | 0.564 | -0.083 |
2020-06-30 | 0.477 | 0.604 | -0.020 |
2020-03-31 | 0.667 | 0.621 | 0.041 |
JBLU Price Target
For more insight on analysts targets of JBLU, see our JBLU price target page. And for a list of of all stocks sorted by upside potential based on analyst target price, see our Top Price Target page.
Average Price Target | $14.41 | Average Broker Recommendation | 1.81 (Hold) |
JetBlue Airways Corporation (JBLU) Company Bio
JetBlue Airways provides passenger air transportation services in the U.S., Caribbean and Latin America. The company was founded in 1998 and is based in Long Island City, New York.
Latest JBLU News From Around the Web
Below are the latest news stories about JETBLUE AIRWAYS CORP that investors may wish to consider to help them evaluate JBLU as an investment opportunity.
Most Active Equity Options For Midday - Wednesday, Dec. 27Here are the most active equity options for midday. |
Too many close calls prompt review of air traffic controller fatigueThe three-member panel will identify potential ways the FAA could better address controller fatigue. |
UPDATE 2-Dutch Schiphol airport plans 460,000 flights for 2024 -documentAmsterdam's Schiphol Airport has proposed accepting around 460,000 flights in 2024, fewer than the airline industry demands but more than environmentalist and residents' groups would like to see, according to a planning document seen by Reuters. The number of flights at Schiphol, one of Europe's largest hubs, has been in doubt since the Dutch government in November was forced to scrap plans for a cap at 452,000 flights amid pressure from the airline industry, the United States and the European Union. In a Royal Schiphol Group document seen by Reuters, the company said allowing 460,000 flights in 2024 was its "preferred scenario" and allowing more - up to 483,000 flights - would only be possible if airlines commit to altering schedules. |
JetBlue Foundation Celebrates 10 Years of Enhancing Access and Inspiring Careers in AviationNEW YORK, December 18, 2023--JetBlue (Nasdaq: JBLU) is proud to celebrate the JetBlue Foundation’s successful decade of inspiring humanity beyond air travel. For the last 10 years, the JetBlue Foundation has continued the airline’s efforts to place aviation top-of-mind as a career choice for students by igniting youth interest throughout JetBlue’s network to explore careers in aviation. The Foundation’s mission centers on providing underrepresented youth, such as those in gender and racial minor |
Is JetBlue a Buy for 2024 After This Year's Big Dip?Industry experts believe next year will be a record-breaking one for the air travel business. But that outlook comes with an important footnote. |
JBLU Price Returns
1-mo | 13.63% |
3-mo | 33.69% |
6-mo | 61.30% |
1-year | 4.51% |
3-year | -62.12% |
5-year | -54.65% |
YTD | 33.69% |
2023 | -14.35% |
2022 | -54.49% |
2021 | -2.06% |
2020 | -22.33% |
2019 | 16.56% |
Continue Researching JBLU
Want to do more research on Jetblue Airways Corp's stock and its price? Try the links below:Jetblue Airways Corp (JBLU) Stock Price | Nasdaq
Jetblue Airways Corp (JBLU) Stock Quote, History and News - Yahoo Finance
Jetblue Airways Corp (JBLU) Stock Price and Basic Information | MarketWatch
Loading social stream, please wait...