John B. Sanfilippo & Son, Inc. (JBSS): Price and Financial Metrics
JBSS Price/Volume Stats
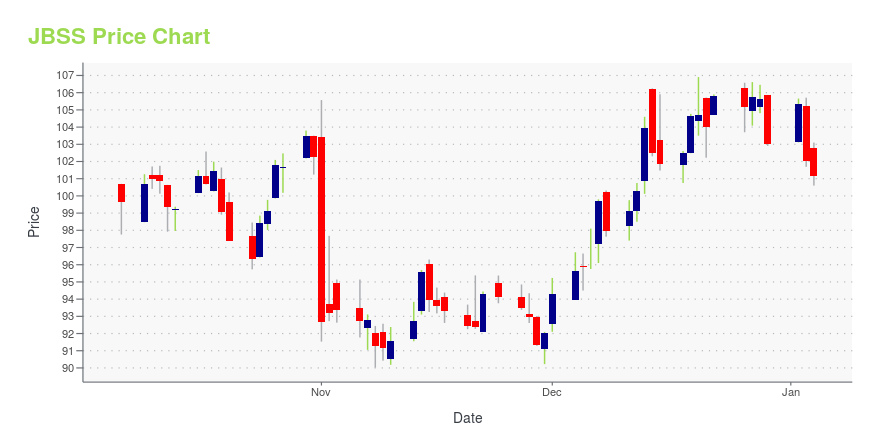
Current price | $91.36 | 52-week high | $127.26 |
Prev. close | $92.96 | 52-week low | $76.49 |
Day low | $91.28 | Volume | 40,900 |
Day high | $93.02 | Avg. volume | 66,731 |
50-day MA | $96.88 | Dividend yield | 0.85% |
200-day MA | $103.58 | Market Cap | 1.06B |
JBSS Stock Price Chart Interactive Chart >
JBSS POWR Grades
- JBSS scores best on the Quality dimension, with a Quality rank ahead of 87.85% of US stocks.
- JBSS's strongest trending metric is Growth; it's been moving down over the last 177 days.
- JBSS's current lowest rank is in the Momentum metric (where it is better than 25.23% of US stocks).
JBSS Stock Summary
- SANFILIPPO JOHN B & SON INC's capital turnover -- a measure of revenue relative to shareholder's equity -- is better than 84.75% of US listed stocks.
- Of note is the ratio of SANFILIPPO JOHN B & SON INC's sales and general administrative expense to its total operating expenses; 87.32% of US stocks have a lower such ratio.
- With a year-over-year growth in debt of -64.04%, SANFILIPPO JOHN B & SON INC's debt growth rate surpasses only 3.5% of about US stocks.
- Stocks that are quantitatively similar to JBSS, based on their financial statements, market capitalization, and price volatility, are ACU, WEYS, ROCK, MYRG, and HWKN.
- Visit JBSS's SEC page to see the company's official filings. To visit the company's web site, go to www.jbssinc.com.
JBSS Valuation Summary
- In comparison to the median Consumer Defensive stock, JBSS's EV/EBIT ratio is 27.6% lower, now standing at 12.2.
- JBSS's price/sales ratio has moved up 0.3 over the prior 243 months.
Below are key valuation metrics over time for JBSS.
Stock | Date | P/S | P/B | P/E | EV/EBIT |
---|---|---|---|---|---|
JBSS | 2023-11-06 | 1.1 | 3.7 | 16.5 | 12.2 |
JBSS | 2023-11-03 | 1.1 | 3.8 | 16.6 | 12.2 |
JBSS | 2023-11-02 | 1.1 | 3.8 | 16.6 | 12.2 |
JBSS | 2023-11-01 | 1.1 | 3.7 | 17.1 | 12.4 |
JBSS | 2023-10-31 | 1.2 | 4.0 | 18.8 | 13.6 |
JBSS | 2023-10-30 | 1.2 | 4.1 | 19.0 | 13.8 |
JBSS Growth Metrics
- The 5 year net cashflow from operations growth rate now stands at 18.87%.
- The 4 year net cashflow from operations growth rate now stands at 18.87%.
- Its 3 year revenue growth rate is now at 3.89%.

The table below shows JBSS's growth in key financial areas (numbers in millions of US dollars).
Date | Revenue | Operating Cash Flow | Net Income to Common Stock |
---|---|---|---|
2022-12-31 | 1,003.261 | 74.736 | 61.743 |
2022-09-30 | 982.14 | 49.347 | 58.083 |
2022-06-30 | 955.868 | 19.604 | 61.787 |
2022-03-31 | 904.862 | 15.116 | 56.716 |
2021-12-31 | 894.17 | 58.582 | 59.54 |
2021-09-30 | 874.538 | 85.023 | 66.178 |
JBSS's Quality Factors
The “Quality” component of the POWR Ratings focuses on 31 different factors of a companies fundamentals and operational strength. Here are some key insights as we drill into the specifics of these quality attributes.- JBSS has a Quality Grade of C, ranking ahead of 74.41% of graded US stocks.
- JBSS's asset turnover comes in at 2.193 -- ranking 5th of 59 Food Products stocks.
- PLAG, CPB, and PARF are the stocks whose asset turnover ratios are most correlated with JBSS.
The table below shows JBSS's key quality metrics over time.
Period | Asset Turnover | Gross Margin | ROIC |
---|---|---|---|
2021-09-23 | 2.193 | 0.226 | 0.288 |
2021-06-24 | 2.167 | 0.215 | 0.261 |
2021-03-25 | 2.148 | 0.209 | 0.251 |
2020-12-24 | 2.106 | 0.204 | 0.240 |
2020-09-24 | 2.135 | 0.198 | 0.232 |
2020-06-25 | 2.158 | 0.200 | 0.235 |
JBSS Price Target
For more insight on analysts targets of JBSS, see our JBSS price target page. And for a list of of all stocks sorted by upside potential based on analyst target price, see our Top Price Target page.
Average Price Target | $107.00 | Average Broker Recommendation | 1 (Strong Buy) |
John B. Sanfilippo & Son, Inc. (JBSS) Company Bio
John B Sanfilippo & Son Inc. processes and distributes peanuts and tree nuts in the United States. The company offers raw and processed nuts, including almonds, pecans, peanuts, black walnuts, English walnuts, cashews, macadamia nuts, pistachios, pine nuts, Brazil nuts, and filberts. The company was founded in 1959 and is based in Elgin, Illinois.
Latest JBSS News From Around the Web
Below are the latest news stories about SANFILIPPO JOHN B & SON INC that investors may wish to consider to help them evaluate JBSS as an investment opportunity.
Should You Be Adding John B. Sanfilippo & Son (NASDAQ:JBSS) To Your Watchlist Today?It's common for many investors, especially those who are inexperienced, to buy shares in companies with a good story... |
John B. Sanfilippo & Son, Inc. (NASDAQ:JBSS) Q1 2024 Earnings Call TranscriptJohn B. Sanfilippo & Son, Inc. (NASDAQ:JBSS) Q1 2024 Earnings Call Transcript November 1, 2023 Operator: Good day and thank you for standing by. Welcome to the John B. Sanfilippo & Son, Inc. First Quarter Fiscal 2024 Operating Results Conference Call. At this time, all participants are in a listen-only mode. After the speakers’ presentation, […] |
Q1 2024 John B Sanfilippo & Son Inc Earnings CallQ1 2024 John B Sanfilippo & Son Inc Earnings Call |
Nut Brand Orchard Valley Harvest Encourages Consumers to 'Say No' To No Nut NovemberNut brand Orchard Valley Harvest is taking on the viral phenomenon of "No Nut November" with a bold new creative campaign and the opportunity for consumers to be reimbursed for their nut purchases during the month. The brand is offering consumers free nuts (and a laugh) as its tenacious mascot "Ovie" seeks to rally support for his cause to say no to No Nut November, and also raise money to fight food insecurity with charitable partners. |
John B. Sanfilippo & Son, Inc. Reports First Quarter Fiscal 2024 ResultsELGIN, Ill., October 31, 2023--John B. Sanfilippo & Son, Inc. (NASDAQ: JBSS) (the "Company") today announced financial results for its fiscal 2024 first quarter ended September 28, 2023. |
JBSS Price Returns
1-mo | -10.66% |
3-mo | -8.77% |
6-mo | -21.38% |
1-year | 12.78% |
3-year | 41.02% |
5-year | 84.93% |
YTD | 16.07% |
2022 | -5.86% |
2021 | 21.46% |
2020 | -10.12% |
2019 | 73.32% |
2018 | -9.02% |
JBSS Dividends
Ex-Dividend Date | Type | Payout Amount | Change | ||||||
---|---|---|---|---|---|---|---|---|---|
Loading, please wait... |
Continue Researching JBSS
Want to see what other sources are saying about Sanfilippo John B & Son Inc's financials and stock price? Try the links below:Sanfilippo John B & Son Inc (JBSS) Stock Price | Nasdaq
Sanfilippo John B & Son Inc (JBSS) Stock Quote, History and News - Yahoo Finance
Sanfilippo John B & Son Inc (JBSS) Stock Price and Basic Information | MarketWatch
Loading social stream, please wait...