John Bean Technologies Corporation (JBT): Price and Financial Metrics

John Bean Technologies Corporation (JBT): $103.81

0.70 (-0.67%)

POWR Rating

Component Grades

Momentum

B

Stability

C

Sentiment

Quality

C

Add JBT to Watchlist
Sign Up

Industry: Industrial - Machinery

Industry

A

Ranked

#72 of 78

in industry

JBT Price/Volume Stats

Current price $103.81 52-week high $125.88
Prev. close $104.51 52-week low $81.59
Day low $103.73 Volume 62,700
Day high $105.05 Avg. volume 150,970
50-day MA $111.40 Dividend yield 0.37%
200-day MA $107.54 Market Cap 3.31B

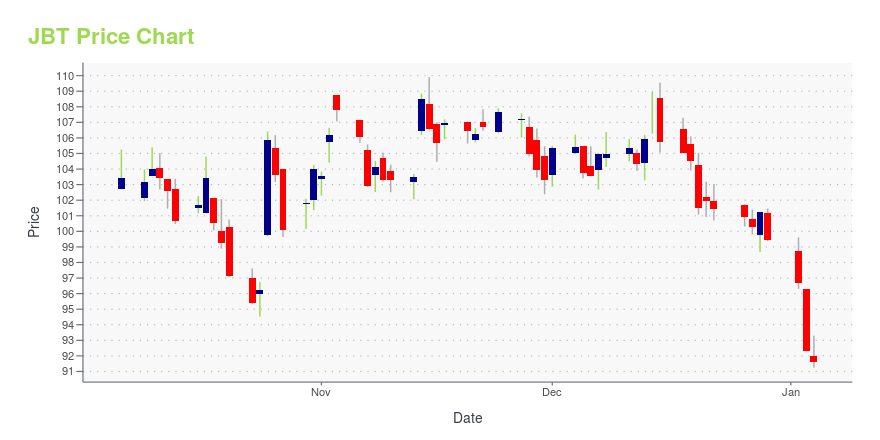
JBT Stock Price Chart Interactive Chart >

JBT POWR Grades

  • Momentum is the dimension where JBT ranks best; there it ranks ahead of 85.35% of US stocks.
  • JBT's strongest trending metric is Value; it's been moving down over the last 179 days.
  • JBT ranks lowest in Growth; there it ranks in the 23rd percentile.

JBT Stock Summary

  • Of note is the ratio of JOHN BEAN TECHNOLOGIES CORP's sales and general administrative expense to its total operating expenses; 83.64% of US stocks have a lower such ratio.
  • With a year-over-year growth in debt of 40.9%, JOHN BEAN TECHNOLOGIES CORP's debt growth rate surpasses 82.71% of about US stocks.
  • In terms of volatility of its share price, JBT is more volatile than only 18.36% of stocks we're observing.
  • Stocks that are quantitatively similar to JBT, based on their financial statements, market capitalization, and price volatility, are PGTI, UTI, FELE, PSO, and RUSHA.
  • Visit JBT's SEC page to see the company's official filings. To visit the company's web site, go to www.jbtc.com.

JBT Valuation Summary

  • In comparison to the median Industrials stock, JBT's price/sales ratio is 15.79% lower, now standing at 1.6.
  • JBT's price/sales ratio has moved up 1.2 over the prior 184 months.

Below are key valuation metrics over time for JBT.

Stock Date P/S P/B P/E EV/EBIT
JBT 2023-09-15 1.6 3.8 27.1 24.1
JBT 2023-09-14 1.7 3.8 27.3 24.2
JBT 2023-09-13 1.7 3.8 27.2 24.2
JBT 2023-09-12 1.6 3.7 26.8 23.9
JBT 2023-09-11 1.6 3.7 26.8 23.9
JBT 2023-09-08 1.6 3.7 26.2 23.5

JBT Growth Metrics

    Its year over year revenue growth rate is now at 13.73%.
  • Its 3 year net income to common stockholders growth rate is now at -4.57%.
  • Its 2 year price growth rate is now at 63.92%.
Over the past 18 months, JBT's revenue has gone up $414,100,000.

The table below shows JBT's growth in key financial areas (numbers in millions of US dollars).

Date Revenue Operating Cash Flow Net Income to Common Stock
2022-12-31 2,166 142.3 130.7
2022-09-30 2,064.5 137 124.8
2022-06-30 1,986.5 140.2 119.9
2022-03-31 1,919.7 179.1 117
2021-12-31 1,868.3 225.7 118.4
2021-09-30 1,810.1 254.2 116.9

JBT's Quality Factors

The “Quality” component of the POWR Ratings focuses on 31 different factors of a companies fundamentals and operational strength. Here are some key insights as we drill into the specifics of these quality attributes.
  • JBT has a Quality Grade of C, ranking ahead of 61.29% of graded US stocks.
  • JBT's asset turnover comes in at 0.951 -- ranking 23rd of 104 Machinery stocks.
  • TTC, TWIN, and FTI are the stocks whose asset turnover ratios are most correlated with JBT.

The table below shows JBT's key quality metrics over time.

Period Asset Turnover Gross Margin ROIC
2021-09-30 0.951 0.309 0.164
2021-06-30 0.948 0.310 0.153
2021-03-31 0.933 0.310 0.149
2020-12-31 0.944 0.309 0.140
2020-09-30 0.987 0.310 0.148
2020-06-30 1.010 0.309 0.158

JBT Price Target

For more insight on analysts targets of JBT, see our JBT price target page. And for a list of of all stocks sorted by upside potential based on analyst target price, see our Top Price Target page.

Average Price Target $149.80 Average Broker Recommendation 1.62 (Moderate Buy)

John Bean Technologies Corporation (JBT) Company Bio


John Bean Technologies designs, manufactures, tests, and services products and systems for food processing and air transportation industries. The company was founded in 2008 and is based in Chicago, Illinois.


JBT Latest News Stream


Event/Time News Detail
Loading, please wait...

JBT Latest Social Stream


Loading social stream, please wait...

View Full JBT Social Stream

Latest JBT News From Around the Web

Below are the latest news stories about JOHN BEAN TECHNOLOGIES CORP that investors may wish to consider to help them evaluate JBT as an investment opportunity.

JBT (JBT) Down 4% Since Last Earnings Report: Can It Rebound?

JBT (JBT) reported earnings 30 days ago. What's next for the stock? We take a look at earnings estimates for some clues.

Yahoo | August 31, 2023

JBT Corporation Declares Quarterly Dividend

CHICAGO, August 10, 2023--JBT Corporation (NYSE: JBT) announced that on August 10, 2023, its Board of Directors declared a quarterly cash dividend of $0.10 per share of outstanding common stock. The dividend will be payable on September 5, 2023, to stockholders of record at the close of business on August 21, 2023.

Yahoo | August 10, 2023

John Bean (JBT) Q2 Earnings Up Y/Y on Strong FoodTech Results

John Bean (JBT) reports a year-over-year improvement in second-quarter 2023 earnings, aided by higher orders and savings from restructuring actions. It completes the sale of the AeroTech segment.

Yahoo | August 2, 2023

JBT Corporation Reports Second Quarter 2023 Results from Continuing Operations and Completes Sale of AeroTech

CHICAGO, August 01, 2023--JBT Corporation (NYSE: JBT), a leading global technology solutions provider to high-value segments of the food & beverage industry, today reported results for the second quarter of 2023. The Company also announced that it completed the sale of AeroTech to Oshkosh Corporation.

Yahoo | August 1, 2023

Will FoodTech Performance Drive John Bean's (JBT) Q2 Earnings?

Improved order levels and a pickup in deliveries due to the easing of supply-chain headwinds, and gains from acquisitions in the FoodTech segment are likely to have aided John Bean (JBT) in Q2.

Yahoo | July 27, 2023

Read More 'JBT' Stories Here

JBT Price Returns

1-mo -5.40%
3-mo -10.73%
6-mo -0.72%
1-year 25.20%
3-year 9.04%
5-year -11.19%
YTD 13.98%
2022 -40.30%
2021 35.24%
2020 1.50%
2019 57.49%
2018 -34.91%

JBT Dividends

Ex-Dividend Date Type Payout Amount Change
Loading, please wait...
View Full JBT Dividend History

Continue Researching JBT

Want to see what other sources are saying about John Bean Technologies CORP's financials and stock price? Try the links below:

John Bean Technologies CORP (JBT) Stock Price | Nasdaq
John Bean Technologies CORP (JBT) Stock Quote, History and News - Yahoo Finance
John Bean Technologies CORP (JBT) Stock Price and Basic Information | MarketWatch

Get Free Updates

Join thousands of investors who get the latest news, insights and top rated picks from StockNews.com!