JELD-WEN Holding, Inc. (JELD): Price and Financial Metrics

JELD-WEN Holding, Inc. (JELD): $21.23

0.65 (+3.16%)

POWR Rating

Component Grades

Momentum

A

Stability

C

Sentiment

Quality

C

Add JELD to Watchlist
Sign Up

Industry: Home Improvement & Goods

Industry

B

Ranked

#16 of 57

in industry

JELD Price/Volume Stats

Current price $21.23 52-week high $21.62
Prev. close $20.58 52-week low $10.96
Day low $20.66 Volume 1,146,500
Day high $21.62 Avg. volume 471,213
50-day MA $18.81 Dividend yield N/A
200-day MA $16.38 Market Cap 1.83B

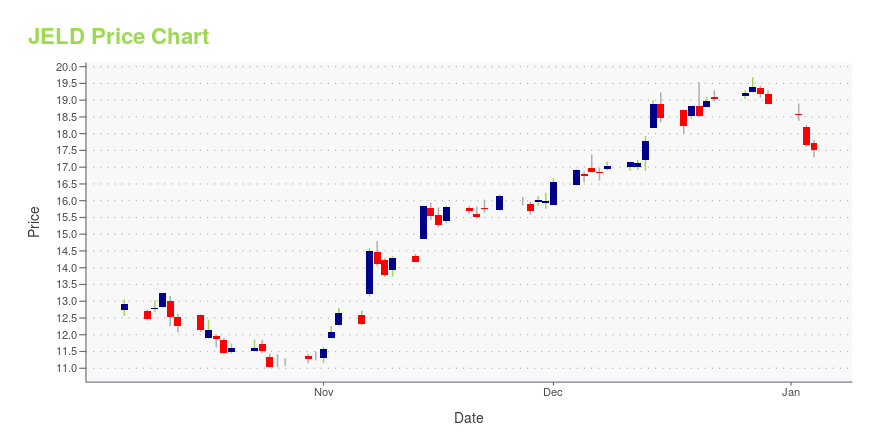
JELD Stock Price Chart Interactive Chart >

JELD POWR Grades

  • Momentum is the dimension where JELD ranks best; there it ranks ahead of 99.42% of US stocks.
  • JELD's strongest trending metric is Quality; it's been moving up over the last 26 weeks.
  • JELD ranks lowest in Sentiment; there it ranks in the 22nd percentile.

JELD Stock Summary

  • The capital turnover (annual revenue relative to shareholder's equity) for JELD is 5.68 -- better than 92.13% of US stocks.
  • With a price/sales ratio of 0.32, JELD-WEN HOLDING INC has a higher such ratio than merely 9.94% of stocks in our set.
  • JELD-WEN HOLDING INC's shareholder yield -- a measure of how much capital is returned to stockholders via dividends and buybacks -- is 41.29%, greater than the shareholder yield of 95.53% of stocks in our set.
  • Stocks that are quantitatively similar to JELD, based on their financial statements, market capitalization, and price volatility, are IBP, ABG, SIG, MOD, and CAL.
  • JELD's SEC filings can be seen here. And to visit JELD-WEN HOLDING INC's official web site, go to www.jeld-wen.com.

JELD Valuation Summary

  • JELD's price/sales ratio is 0.3; this is 80% lower than that of the median Basic Materials stock.
  • Over the past 84 months, JELD's price/sales ratio has gone down 0.5.

Below are key valuation metrics over time for JELD.

Stock Date P/S P/B P/E EV/EBIT
JELD 2023-12-29 0.3 1.9 12.3 10.9
JELD 2023-12-28 0.3 2.0 12.5 11.0
JELD 2023-12-27 0.3 2.0 12.6 11.1
JELD 2023-12-26 0.3 2.0 12.5 11.0
JELD 2023-12-22 0.3 1.9 12.4 10.9
JELD 2023-12-21 0.3 1.9 12.4 10.9

JELD Growth Metrics

    Its year over year cash and equivalents growth rate is now at -56.45%.
  • The 2 year revenue growth rate now stands at 13.89%.
  • The 4 year price growth rate now stands at -62.91%.
JELD's revenue has moved up $794,975,000 over the prior 33 months.

The table below shows JELD's growth in key financial areas (numbers in millions of US dollars).

Date Revenue Operating Cash Flow Net Income to Common Stock
2022-09-30 5,084.736 -33.044 54.191
2022-06-30 4,935.511 -30.786 127.925
2022-03-31 4,850.358 53.68 142.809
2021-12-31 4,771.719 175.666 168.822
2021-09-30 4,636.061 280.358 169.976
2021-06-30 4,602.342 358.081 154.914

JELD's Quality Factors

The “Quality” component of the POWR Ratings focuses on 31 different factors of a companies fundamentals and operational strength. Here are some key insights as we drill into the specifics of these quality attributes.
  • JELD has a Quality Grade of C, ranking ahead of 64.66% of graded US stocks.
  • JELD's asset turnover comes in at 1.175 -- ranking 15th of 60 Construction Materials stocks.
  • SNA, B, and DOOR are the stocks whose asset turnover ratios are most correlated with JELD.

The table below shows JELD's key quality metrics over time.

Period Asset Turnover Gross Margin ROIC
2021-09-25 1.175 0.216 0.079
2021-06-26 1.165 0.221 0.080
2021-03-27 1.122 0.217 0.066
2020-12-31 1.135 0.213 0.056
2020-09-26 1.158 0.207 0.050
2020-06-27 1.195 0.203 0.050

JELD-WEN Holding, Inc. (JELD) Company Bio


JELD-WEN, inc. manufactures and distributes windows, doors, and treated composite trim and panels for homes and commercial buildings. The company was founded in 1960 and is based in Charlotte, North Carolina.


JELD Latest News Stream


Event/Time News Detail
Loading, please wait...

JELD Latest Social Stream


Loading social stream, please wait...

View Full JELD Social Stream

Latest JELD News From Around the Web

Below are the latest news stories about JELD-WEN HOLDING INC that investors may wish to consider to help them evaluate JELD as an investment opportunity.

JELD-WEN to Release Fourth Quarter and Full Year 2023 Results

JELD-WEN Holding, Inc. (NYSE: JELD), a leading global manufacturer of building products, announced today that it will release fourth quarter and full year 2023 results on Monday, February 19, 2024. The company will hold a conference call to discuss the results at 8 a.m. ET on Tuesday, February 20, 2024.

Yahoo | December 20, 2023

JELD-WEN Holding, Inc. (NYSE:JELD) Screens Well But There Might Be A Catch

There wouldn't be many who think JELD-WEN Holding, Inc.'s ( NYSE:JELD ) price-to-earnings (or "P/E") ratio of 14.7x is...

Yahoo | December 18, 2023

JELD-WEN Holding, Inc. (NYSE:JELD) Q3 2023 Earnings Call Transcript

JELD-WEN Holding, Inc. (NYSE:JELD) Q3 2023 Earnings Call Transcript November 7, 2023 Operator: Thank you for standing by and welcome to the JELD-WEN Holding, Inc. Third Quarter 2023 Earnings Conference Call. I would now like to welcome James Armstrong, Vice President of Investor Relations to begin the call. James, over to you. James Armstrong: Thank […]

Yahoo | November 8, 2023

JELD-WEN Holding Inc (JELD) Reports Q3 2023 Results, Raises Full-Year Guidance

Despite a decrease in net revenues, the company sees a significant increase in net income and raises its full-year guidance

Yahoo | November 6, 2023

JELD-WEN Reports Third Quarter 2023 Results and Updates Full-Year Guidance

JELD-WEN Holding, Inc. (NYSE: JELD) ("JELD-WEN" or the "Company") today announced results for the three and nine months ended September 30, 2023. The Company is raising its full-year guidance for continuing operations to reflect its solid third quarter results. Comparability is to the same period in the prior year and all periods presented reflect the Company's Australasia segment as a discontinued operation, as appropriate and unless otherwise noted.

Yahoo | November 6, 2023

Read More 'JELD' Stories Here

JELD Price Returns

1-mo 19.94%
3-mo 12.45%
6-mo 58.91%
1-year 74.30%
3-year -22.18%
5-year 20.22%
YTD 12.45%
2023 95.65%
2022 -63.39%
2021 3.94%
2020 8.33%
2019 64.74%

Get Free Updates

Join thousands of investors who get the latest news, insights and top rated picks from StockNews.com!