Janus Henderson Group PLC (JHG): Price and Financial Metrics
GET POWR RATINGS... FREE!
JHG POWR Grades
- Quality is the dimension where JHG ranks best; there it ranks ahead of 77.56% of US stocks.
- The strongest trend for JHG is in Value, which has been heading up over the past 179 days.
- JHG ranks lowest in Sentiment; there it ranks in the 8th percentile.
JHG Stock Summary
- The ratio of debt to operating expenses for Janus Henderson Group Plc is higher than it is for about merely 17.86% of US stocks.
- Over the past twelve months, JHG has reported earnings growth of 259.23%, putting it ahead of 91.73% of US stocks in our set.
- Shareholder yield, a measure of how much is returned to shareholders via dividends and share repurchases, for JHG comes in at 11.28% -- higher than that of 85.73% of stocks in our set.
- Stocks with similar financial metrics, market capitalization, and price volatility to Janus Henderson Group Plc are PNFP, PFIS, PPBI, IBTX, and WNEB.
- Visit JHG's SEC page to see the company's official filings. To visit the company's web site, go to www.janushenderson.com.
JHG Valuation Summary
- JHG's price/sales ratio is 2.8; this is 12.5% lower than that of the median Financial Services stock.
- Over the past 50 months, JHG's price/sales ratio has gone down 3.
- Over the past 50 months, JHG's EV/EBIT ratio has gone down 20.3.
Below are key valuation metrics over time for JHG.
Stock | Date | P/S | P/B | P/E | EV/EBIT |
---|---|---|---|---|---|
JHG | 2020-12-29 | 2.6 | 1.3 | 67.9 | 38.1 |
JHG | 2019-06-03 | 1.8 | 0.8 | 8.7 | 5.7 |
JHG | 2018-04-16 | 3.6 | 1.3 | 9.6 | 12.9 |
JHG | 2017-12-26 | 6.8 | 1.7 | 43.9 | 32.8 |
JHG | 2017-10-24 | 6.2 | 1.6 | 40.3 | 30.2 |
JHG | 2017-09-15 | 5.9 | 1.5 | 38.0 | 28.4 |
JHG's Quality Factors
The “Quality” component of the POWR Ratings focuses on 31 different factors of a companies fundamentals and operational strength. Here are some key insights as we drill into the specifics of these quality attributes.- JHG has a Quality Grade of C, ranking ahead of 67.65% of graded US stocks.
- JHG's asset turnover comes in at 0.411 -- ranking 57th of 444 Trading stocks.
- WY, AVB, and DEI are the stocks whose asset turnover ratios are most correlated with JHG.
The table below shows JHG's key quality metrics over time.
Period | Asset Turnover | Gross Margin | ROIC |
---|---|---|---|
2021-09-30 | 0.411 | 1 | 0.773 |
2021-06-30 | 0.398 | 1 | 0.725 |
2021-03-31 | 0.363 | 1 | 0.616 |
2020-12-31 | 0.347 | 1 | 0.180 |
2020-09-30 | 0.327 | 1 | 0.094 |
2020-06-30 | 0.316 | 1 | 0.085 |
JHG Price Target
For more insight on analysts targets of JHG, see our JHG price target page. And for a list of of all stocks sorted by upside potential based on analyst target price, see our Top Price Target page.
Average Price Target | $42.68 | Average Broker Recommendation | 2.06 (Hold) |
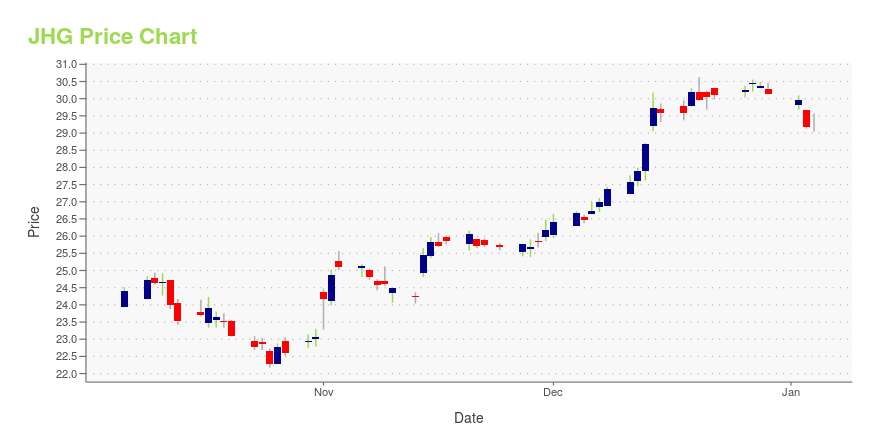
JHG Stock Price Chart Interactive Chart >
JHG Price/Volume Stats
Current price | $23.53 | 52-week high | $48.55 |
Prev. close | $23.51 | 52-week low | $22.68 |
Day low | $22.94 | Volume | 933,100 |
Day high | $23.67 | Avg. volume | 1,213,509 |
50-day MA | $27.23 | Dividend yield | 6.63% |
200-day MA | $36.62 | Market Cap | 3.95B |
Janus Henderson Group PLC (JHG) Company Bio
Janus Henderson Group plc provides retirement planning, investment planning, tax planning, investment for college, and tax planning services to its clients. The company was founded in 1969 and is based in Denver Colorado.
Latest JHG News From Around the Web
Below are the latest news stories about Janus Henderson Group Plc that investors may wish to consider to help them evaluate JHG as an investment opportunity.
Henderson Group owners honour longest-serving HGV driverThe longest serving HGV driver in Henderson Group history has been honoured at a special retirement lunch with the owners and directors of the business. |
Henderson Group launches ‘Mega’ value impact for NI shoppersFresh from its announcement of a multi-million-pound strategy supporting value and community retailing in 2022, Henderson Group has launched the latest in a series of value-driving initiatives for shoppers and retailers across Northern Ireland. |
Janus Funds - 10 Best Janus Mutual FundsTop-Rated Janus Mutual Funds as of 1/31/22 Fund Name, Ticker, Overall Rating, (Risk Grade) Janus Henderson Forty Inst A+ (C) Janus Henderson Gl Tch & Innov Inst A (C) Janus Henderson Forty A A (C) ... |
Is Janus Henderson Global Technology T (JAGTX) a Strong Mutual Fund Pick Right Now?Mutual Fund Report for JAGTX |
ICVX stock gains after Janus Henderson stake (NASDAQ:ICVX)Newly IPO’ed biotech company Icosavax < |
JHG Price Returns
1-mo | -14.31% |
3-mo | -30.12% |
6-mo | -41.88% |
1-year | N/A |
3-year | 28.29% |
5-year | -1.54% |
YTD | -42.44% |
2021 | 34.18% |
2020 | 44.68% |
2019 | 25.86% |
2018 | -43.21% |
2017 | 49.30% |
JHG Dividends
Ex-Dividend Date | Type | Payout Amount | Change | ||||||
---|---|---|---|---|---|---|---|---|---|
Loading, please wait... |
Continue Researching JHG
Want to do more research on Janus Henderson Group Plc's stock and its price? Try the links below:Janus Henderson Group Plc (JHG) Stock Price | Nasdaq
Janus Henderson Group Plc (JHG) Stock Quote, History and News - Yahoo Finance
Janus Henderson Group Plc (JHG) Stock Price and Basic Information | MarketWatch
Loading social stream, please wait...