
Jack Henry & Associates Inc. (JKHY): Price and Financial Metrics
JKHY Price/Volume Stats
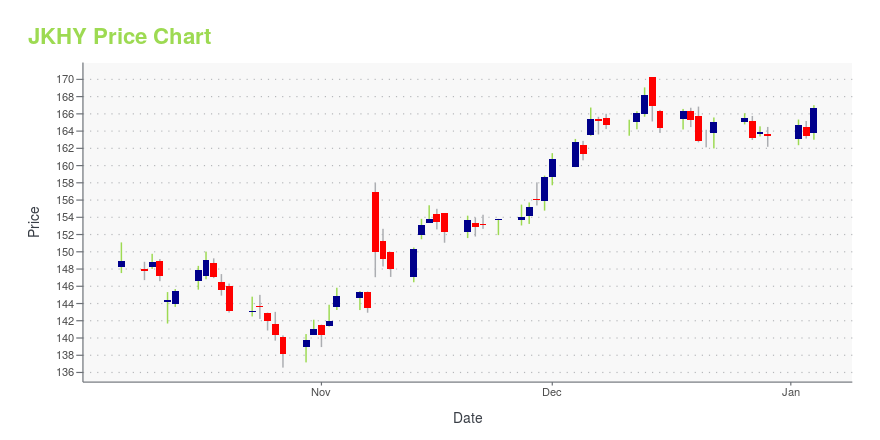
| Current price | $170.33 | 52-week high | $178.37 |
| Prev. close | $167.48 | 52-week low | $136.57 |
| Day low | $168.01 | Volume | 237,151 |
| Day high | $170.58 | Avg. volume | 429,969 |
| 50-day MA | $165.47 | Dividend yield | 1.32% |
| 200-day MA | $163.78 | Market Cap | 12.42B |
JKHY Stock Price Chart Interactive Chart >
Jack Henry & Associates Inc. (JKHY) Company Bio
Jack Henry & Associates, Inc.is an American technology company and payment processing service for the financial services industry. It serves more than 9,000 customers nationwide, and operates through three primary brands. Headquartered in Monett, Missouri, JHA made $1.55 billion in annual revenue during fiscal 2019. (Source:Wikipedia)
Latest JKHY News From Around the Web
Below are the latest news stories about JACK HENRY & ASSOCIATES INC that investors may wish to consider to help them evaluate JKHY as an investment opportunity.
Jack Henry Named to Newsweek's America's Greatest Workplaces 2024 for DiversityJack Henry™ announced today its recognition as one of America's Greatest Workplaces for Diversity 2024 by Newsweek and Plant-A Insights Group. Jack Henry received the highest possible rating (5 stars) based on a comprehensive independent evaluation that included analysis of publicly available data, interviews with HR professionals, and an anonymous online survey of more than 220,000 individuals. |
Twilio and Jack Henry Shape the Future of Financial Services with Personalized ExperiencesSAN FRANCISCO, December 12, 2023--Twilio Inc. (NYSE: TWLO), the customer engagement platform that drives real-time, personalized experiences for today’s leading brands, and Jack Henry™ (Nasdaq: JKHY) today announced Jack Henry is leveraging a suite of Twilio products to enable banks and credit unions to better communicate and engage with their customers across digital channels. |
Wealth Access Joins the Jack Henry™ Vendor Integration ProgramNASHVILLE, Tenn., December 12, 2023--Wealth Access today announced that it has joined the Jack Henry™ Vendor Integration Program (VIP). |
Jack Henry (JKHY) Up 10.3% Since Last Earnings Report: Can It Continue?Jack Henry (JKHY) reported earnings 30 days ago. What's next for the stock? We take a look at earnings estimates for some clues. |
Jack Henry Recognized on Newsweek's America's Most Responsible Companies 2024 ListJack Henry™ (Nasdaq: JKHY) was named as one of America's most responsible companies by Newsweek. This prestigious award is presented by Newsweek and Statista Inc., the world-leading statistics portal and industry ranking provider. |
JKHY Price Returns
| 1-mo | 1.93% |
| 3-mo | 3.64% |
| 6-mo | 1.10% |
| 1-year | 1.82% |
| 3-year | 0.27% |
| 5-year | 28.69% |
| YTD | 4.91% |
| 2023 | -5.66% |
| 2022 | 6.24% |
| 2021 | 4.32% |
| 2020 | 12.37% |
| 2019 | 16.44% |
JKHY Dividends
| Ex-Dividend Date | Type | Payout Amount | Change | ||||||
|---|---|---|---|---|---|---|---|---|---|
| Loading, please wait... | |||||||||
Continue Researching JKHY
Want to do more research on Henry Jack & Associates Inc's stock and its price? Try the links below:Henry Jack & Associates Inc (JKHY) Stock Price | Nasdaq
Henry Jack & Associates Inc (JKHY) Stock Quote, History and News - Yahoo Finance
Henry Jack & Associates Inc (JKHY) Stock Price and Basic Information | MarketWatch
Loading social stream, please wait...