
Jackson Financial Inc. (JXN): Price and Financial Metrics
JXN Price/Volume Stats
| Current price | $91.71 | 52-week high | $115.22 |
| Prev. close | $90.56 | 52-week low | $64.70 |
| Day low | $90.49 | Volume | 155,285 |
| Day high | $92.27 | Avg. volume | 771,778 |
| 50-day MA | $86.48 | Dividend yield | 3.6% |
| 200-day MA | $0.00 | Market Cap | 6.55B |
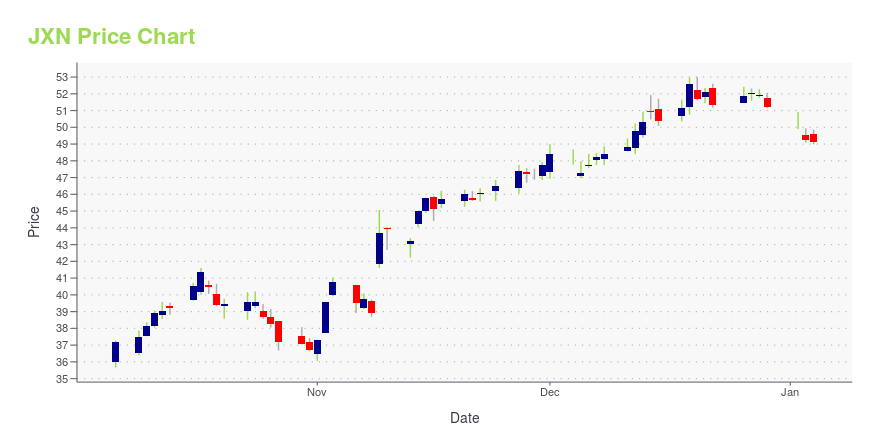
JXN Stock Price Chart Interactive Chart >
JXN Price Returns
| 1-mo | 5.38% |
| 3-mo | 3.77% |
| 6-mo | 2.02% |
| 1-year | 15.00% |
| 3-year | 218.18% |
| 5-year | N/A |
| YTD | 7.39% |
| 2024 | 76.45% |
| 2023 | 57.22% |
| 2022 | -11.54% |
| 2021 | N/A |
| 2020 | N/A |
JXN Dividends
| Ex-Dividend Date | Type | Payout Amount | Change | ||||||
|---|---|---|---|---|---|---|---|---|---|
| Loading, please wait... | |||||||||
Loading social stream, please wait...